EXHIBIT 99.1
Published on February 10, 2012
Dynex
Capital, Inc. Value Forum
InvestFest 2012
February 11, 2012
Exhibit 99.1 |

2
2
Safe Harbor Statement
NOTE:
This presentation contains forward-looking statements within the meaning of
the Private Securities Litigation Reform Act of 1995, including statements about
projected future investment strategies and leverage ratios, financial performance, the
projected impact of NOL carryforwards, future dividends paid to shareholders, and
future investment opportunities and capital raising activities. The words will, believe,
expect, forecast, anticipate, intend,
estimate, assume, project, plan, continue, and similar
expressions also identify forward-looking statements that are inherently subject to risks
and uncertainties, some of which cannot be predicted or quantified. Although these
forward-looking statements reflect our current beliefs, assumptions and
expectations based on information currently available to us, the Companys actual
results and timing of certain events could differ materially from those projected in or
contemplated by these statements. Our forward-looking statements are subject to the
following principal risks and uncertainties: our ability to find suitable reinvestment
opportunities; changes in economic conditions; changes in interest rates and interest
rate spreads, including the repricing of interest-earnings assets and
interest-bearing liabilities; our investment portfolio performance particularly as it relates to cash
flow, prepayment rates and credit performance; adverse reactions in financial markets related
to the budget deficit or national debt of the United States government; potential or
actual default by the United States government on Treasury securities; and potential or
actual downgrades to the sovereign credit rating of the United States or the credit
ratings of GSEs; the cost and availability of financing; the cost and availability of
new equity capital; changes in our use of leverage; the quality of performance of
third-party service providers of our loans and loans underlying our
securities; the level of defaults by borrowers on loans we have securitized;
changes in our industry; increased competition; changes in government regulations
affecting our business; government initiatives to support the U.S financial system and U.S.
housing and real estate markets; GSE reform or other government policies and actions;
and an ownership shift under Section 382 of the Internal Revenue Code that impacts the
use of our tax NOL carryforward. For additional information, see the Companys
Annual Report on Form 10-K for the year ended December 31, 2010, the Companys
Quarterly Reports on Form 10-Q for the quarters ended March 31, 2011, June 30, 2011, and
September 30, 2011 and other reports filed with and furnished to the Securities and Exchange
Commission.
|
3
3
DX Snapshot
Company Highlights
Internally managed REIT commenced operations in 1988
Significant insider ownership and experienced management team
Diversified investment strategy in residential and commercial mortgage assets
Large NOL carryfoward for unique total return opportunity
Market Highlights (as of 2/7/2012 unless indicated)
NYSE Stock Ticker
DX
Shares Outstanding
54,117,772
Quarterly Dividend/Dividend Yield
$0.28/12.3%
Share Price
$9.14
Price to Book (based on BV per share as of 9/30/2011)
1.0x
Market Capitalization
$494.64 million |

4
Dynex at an Inflection Point
Consistent Core Investment Strategy Since 2008
Short duration, high quality, and modest leverage has produced stable returns and
increasing dividends
Opportunistic asset allocation has avoided investment landmines
Diversified asset opportunity
Current Investment Opportunity
Federal Reserve recent ZIRP extension to 2014
Non-Agency sector attractive with 16-20% low leverage returns
Agency MBS spreads continue to offer attractive returns given the current macro
environment
Selective securities will help mitigate prepay risk, credit risk, and extension risk
Track Record
Dynex has delivered an annualized total return of 11.5% since 2008, assuming
reinvestment of dividends (source: Bloomberg)
Book value has grown from $8.07 in Q1 2008 to $9.15 at Q3 2011
Maintained consistent investment strategy without sacrificing risk for return
Opportunistic capital raises have increased core earnings with little dilution
|
5
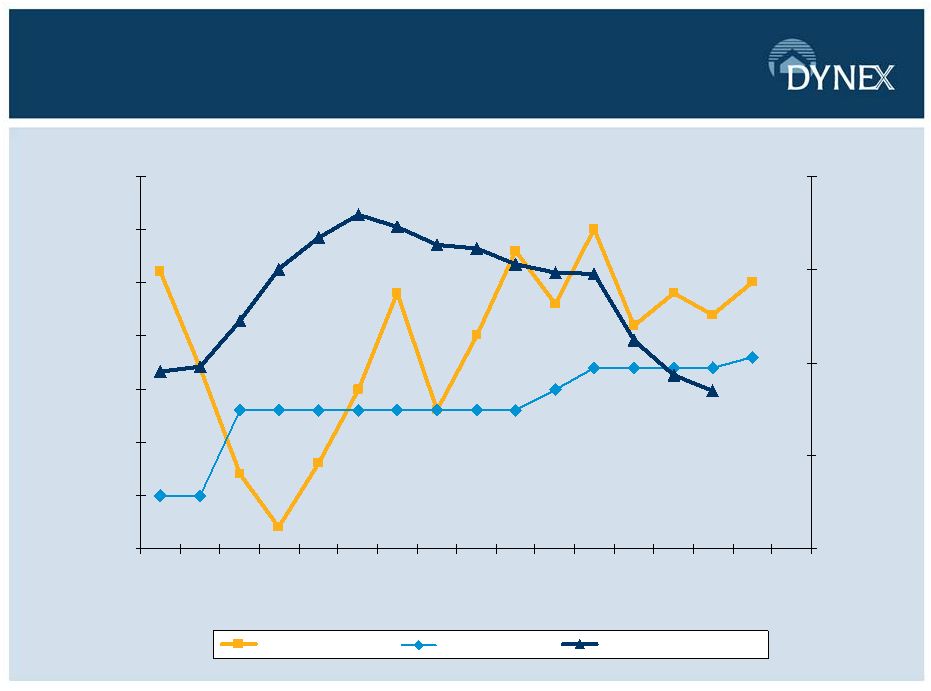
Performance Trends
$0.36
$0.28
$0.15
2.90%
2.69%
$0.10
$0.15
$0.20
$0.25
$0.30
$0.35
$0.40
$0.45
Q1
08
Q2
08
Q3
08
Q4
08
Q1
09
Q2
09
Q3
09
Q4
09
Q1
10
Q2
10
Q3
10
Q4
10
Q1
11
Q2
11
Q3
11
Q4
11
Q1
12
1%
2%
3%
4%
5%
Diluted EPS (LHS)
Dividends (LHS)
G&A % of equity (RHS)
$294 million in equity capital
raised since December 2010
$0.35 -$0.37**
*
See Footnotes *
and **
on Slide 6
4.59% |
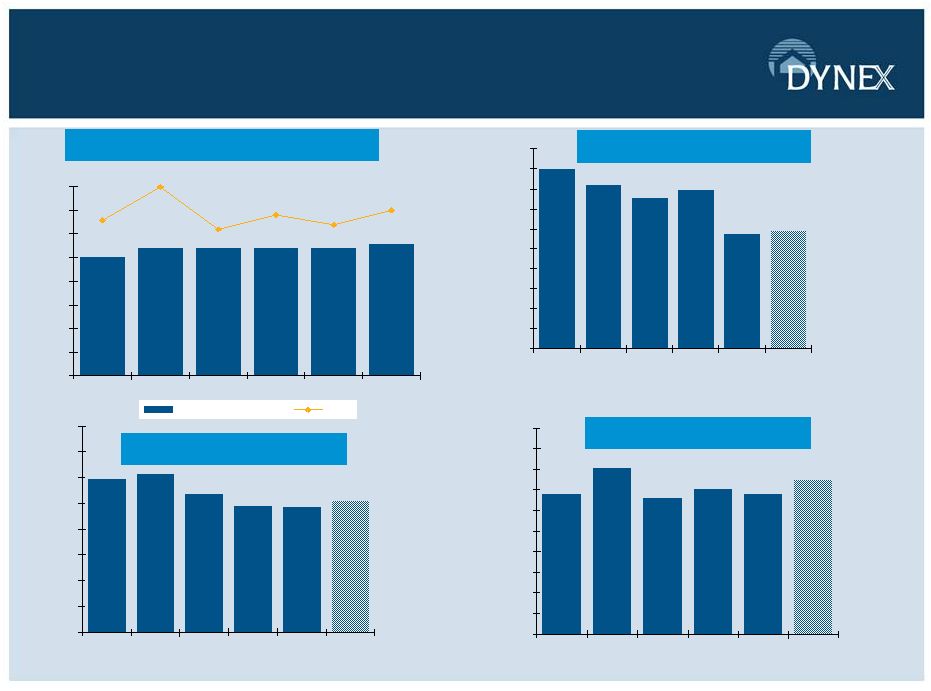
6
Summary of Results
$0.28
$0.25
$0.27
$0.27
$0.27
$0.27
$0.35-$0.37
$0.34
$0.32
$0.31
$0.40
$0.33
$0.00
$0.05
$0.10
$0.15
$0.20
$0.25
$0.30
$0.35
$0.40
Q3-2010
Q4-2010
Q1-2011
Q2-2011
Q3-2011
Q4-2011
Dividend per Share
EPS*
Dividends and Earnings Per Share*
$9.18-$9.22**
$9.80
$9.64
$9.51
$9.59
$9.15
$8.00
$8.20
$8.40
$8.60
$8.80
$9.00
$9.20
$9.40
$9.60
$9.80
$10.00
Q3-2010
Q4-2010
Q1-2011
Q2-2011
Q3-2011
Q4-2011
Book Value Per Share
2.43%
2.45%
2.68%
3.07%
2.98%
2.53%-2.59%**
0.00%
0.50%
1.00%
1.50%
2.00%
2.50%
3.00%
3.50%
4.00%
Q3-2010
Q4-2010
Q1-2011
Q2-2011
Q3-2011
Q4-2011
15.3%-16.2%**
13.61%
16.17%
13.20%
14.10%
13.70%
0%
2%
4%
6%
8%
10%
12%
14%
16%
18%
20%
Q3-2010
Q4-2010
Q1-2011
Q2-2011
Q3-2011
Q4-2011
Net Interest Spread
Return on Average Equity*
**
*
*
*As presented on this slide, Q3-2011 earnings per share and return on average equity exclude the
impact of certain items (EPS Ex-Items). EPS Ex-Items for Q3-2011 excludes from GAAP earnings per share the impact of litigation settlement
and related defense costs of $8.2 million (or $0.20 per diluted common share), a loss of $2.0 million
(or $0.05 per diluted common share) on redemption of non-recourse collateralized financings, and $1.3 million (or $0.03 per diluted common
share) in net accelerated premium amortization due to an increase in forecasted prepayment speeds
during the third quarter of 2011. Reported diluted EPS for Q3-2011 was $0.04.
**Year end 2011 projected range
|
7
Investment Portfolio Review
Our portfolio is constructed to perform well despite volatile markets as we
have focused on high credit quality short duration assets.
We continue to maintain a selective approach to adding assets to
help
minimize prepayment risk.
We allocated our prior two capital raises between agency and non-
agency securities backed by both residential and commercial loans.
As spreads widened in 2011 we rotated our marginal investments into the
CMBS sector with our main focus on the multi-family marketplace.
There is a great opportunity to grow this strategy further as CMBS
spreads continue to be attractive and agency securities offer mid-teens
returns.
We have confidence in our risk profile as we have steadily generated
double-digit returns without extending far out of the risk spectrum.
The DX portfolio has weathered multiple market challenges since 2008
including high volatility, lower interest rates, and a faster prepayment
environment, the FN/FH buyouts of 2010, wider non-agency securities
spreads. |
8
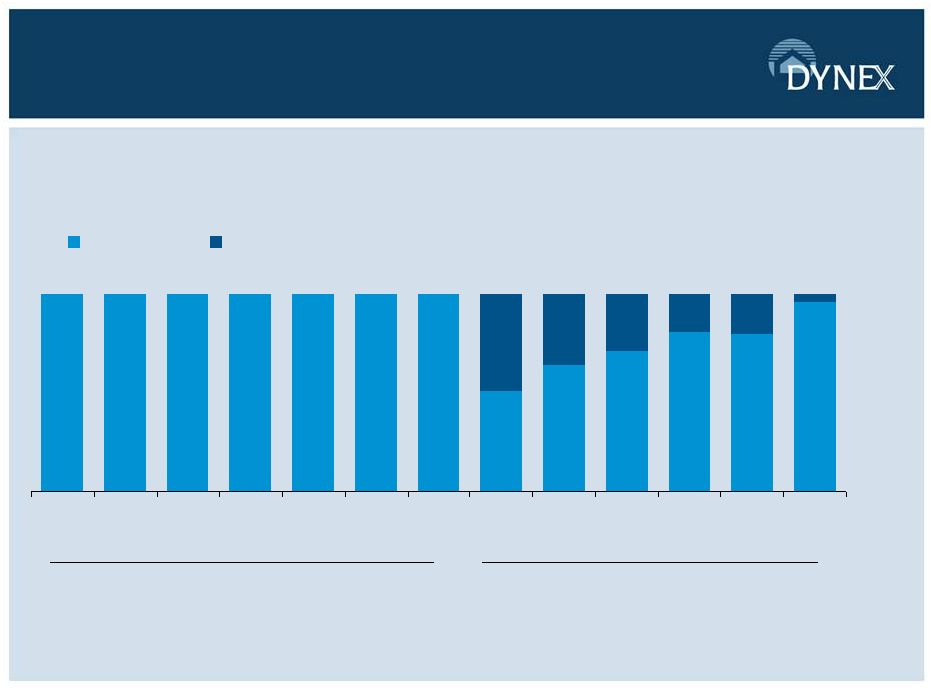
Portfolio Comparisons
(as of Q3 2011 except where indicated)
100%
100%
100%
100%
100%
100%
100%
51%
64%
71%
81%
80%
96%
4%
20%
19%
29%
49%
36%
NLY
Q3
AGNC
Q3
HTS
Q3
CYS
Q3
CMO
Q4
ANH
Q3
ARR
Q3
CIM
Q3
MFA
Q3
IVR
Q3
TWO
Q3
DX
Q3
MTGE
Q3
Agency
Non-Agency
Agency
Hybrid
Source: J.P. Morgan (describing figures as based on company filings, press releases
and presentations) |
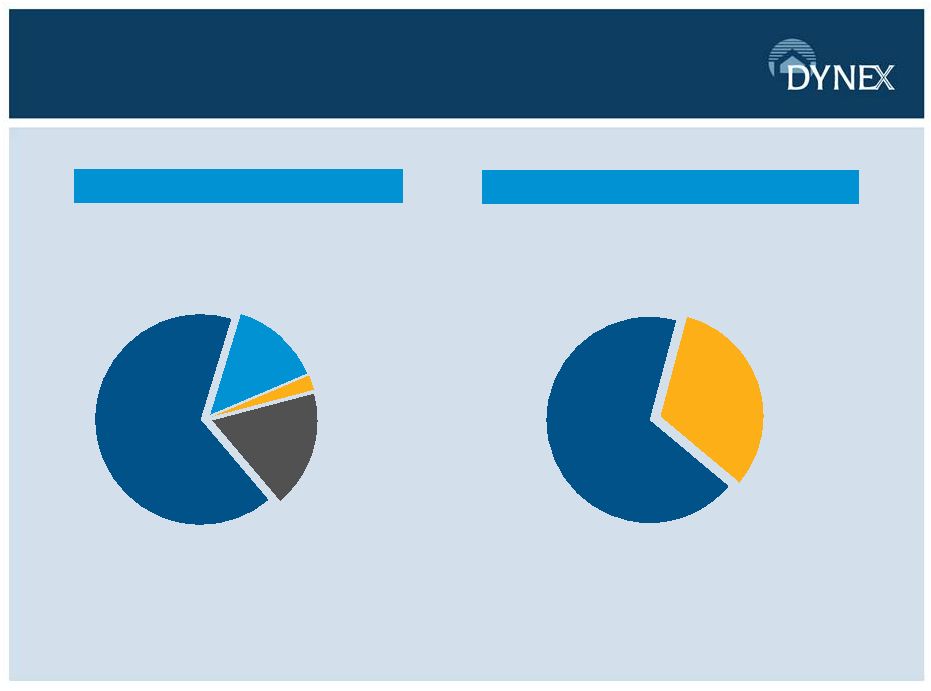
9
DX Portfolio Detail
(as of September 30, 2011)
Non-Agency
CMBS/Loans
18
%
Non-Agency
RMBS/Loans
2%
Agency RMBS
66%
Agency CMBS
14%
CMBS
32%
RMBS
68%
Agency/Non-Agency Breakdown
Residential/Commercial Breakdown |

10
OUR GOAL IS TO LIMIT
CREDIT, INTEREST RATE,
PREPAYMENT, AND
EXTENSION RISK IN OUR
INVESTMENT PORTFOLIO |
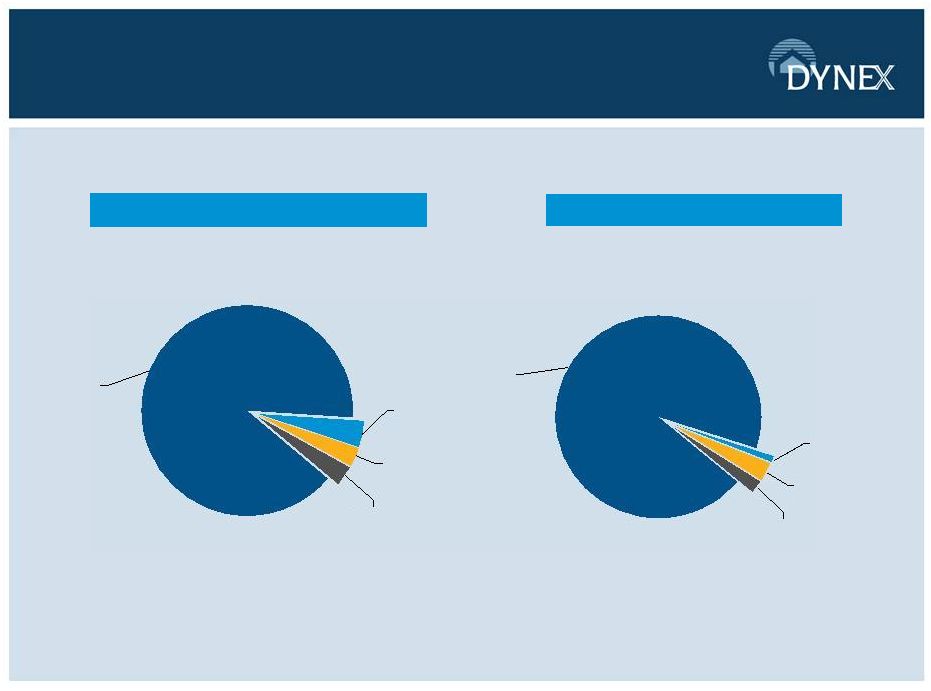
11
High Credit Quality Portfolio
A
3%
Below A
3%
AA
4%
AAA
90%
As of September 30, 2011
As of June 30, 2011
*Agency securities are considered AAA rated as of the dates presented
A
3%
Below A
2%
AA
1%
AAA
94% |
12
Interest Rate Risk Comparisons
Change in Value from Change in Rates
Portfolio Value
(2)
Equity Value
(3)
Ticker
+50
+75
+100
+75
+100
AGENCY MBS
NLY
6.3
-1.80%
-2.50%
-15.8%
ANH
7.0
-1.0%
-7.0%
HTS
7.9
-0.35%
-1.45%
-11.5%
AGNC
7.6
-0.2%
-0.8%
-6.08%
CYS
8.1
-2.14%
-3.25%
-26.3%
ARR
9.5
-0.79%
-1.74%
-16.5%
DIVERSIFIED MBS
DX
6.1
-0.50%
-1.20%
-7.3%
IVR
5.3
-0.23%
-0.73%
-6.6%
MFA
2.9
-0.16%
-0.44%
-3.5%
TWO
3.8
-0.20%
-0.30%
-2.3%
CIM
1.8
-2.50%
-3.79%
-6.8%
(1) As disclosed in each companys 10-Q for quarter ended September
30, 2011. Ratios are dependent on each companys method of calculation.
(2) As of September 30, 2011, as disclosed in each companys 10-Q
for quarter ended September 30, 2011. Percentages are dependent on each companys
assumptions, as disclosed in their 10-Qs.
(3) )
Figure shown for TWO is disclosed in 10-Q for quarter ended September 30,
2011. All others equal estimated percentage decrease for the +75/+100 scenarios
multiplied by estimated company leverage, and are meant to show the potential
change in equity value for the corresponding change in rates. Estimated
Company
Leverage
(1) |
13
Extension Risk
(as of September 30, 2011)
0
2
4
6
8
10
12
14
16
FN 30 year
FNCI 15 year
5/1 ARM
15 CPR/CPB
2 CPR/CPB
Average
Life
(years)
Price
Coupon
WAC
Speed
Average Life
Average Life Extension
FN 30yr
$103-10
4.00%
4.43%
15 CPR
2 CPR
5.41 years
14.78 years
~9 years
FNCI 15yr
$103-10
3.50%
3.80%
15 CPR
2 CPR
4.01 years
6.98 years
~3 years
5/1 ARM
$103-2
2.75%
3.16%
15 CPB
2 CPB
3.35 years
4.57 years
~1 year |
14
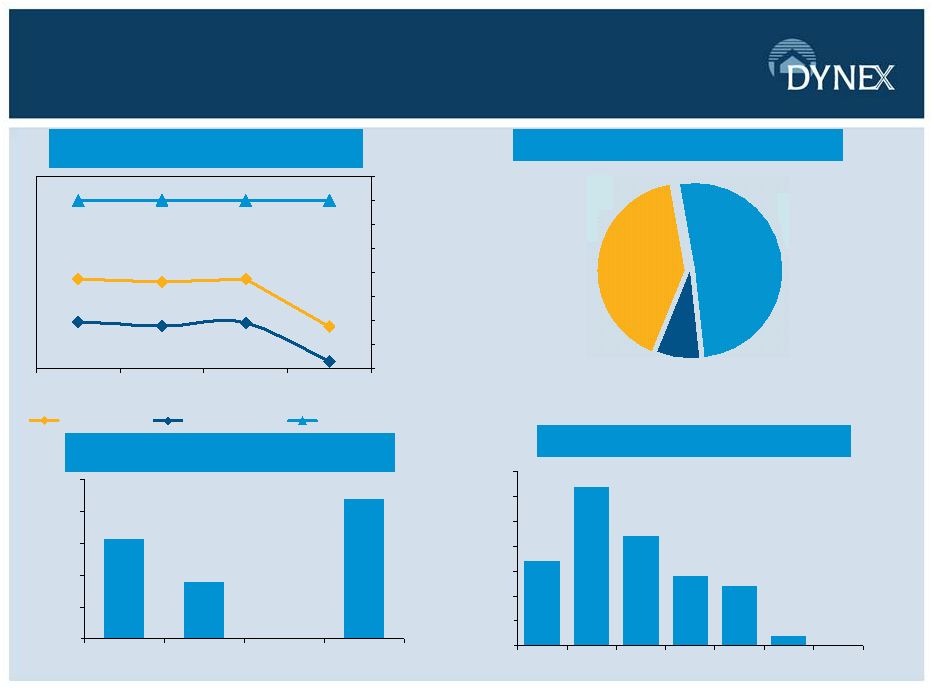
Portfolio Snapshot
(as of September 30, 2011, unless indicated)
$0
$50,000
$100,000
$150,000
$200,000
$250,000
prior to 2000
2000-2005
2006-2008
2009 or
newer
Prepayment Performance
through December 31. 2011
Dollar Premium Prepayment Exposure
0%
2%
12%
14%
17%
22%
32%
0%
5%
10%
15%
20%
25%
30%
35%
<15
16-40
41-60
61-84
85-120
120-125
125-360
Post/near
reset*
8%
Selected
specified
pools
41%
Explicit
prepayment
protection
51%
21.5%
21.2%
21.5%
17.5%
17.9%
17.6%
17.8%
14.6%
28%
28%
28%
28%
14%
16%
18%
20%
22%
24%
26%
28%
30%
1 mo
3 mo
6 mo
1 year
Agency MBS
Total portfolio
Future modeled Agency MBS
Non-Agency CMBS Vintage Portfolio
by year of origination
Portfolio Maturity/Reset Distribution |
15
Trading Comparables
14.10%
14.9%
4.1%
12.2%
16.1%
16.4%
13.4%
3.40%
Dividend Yield
Excess return
Debt to equity (x)
Dividend Yields
CIM
MFA
IVR
TWO
DX
MTGE
Agency
REITS
Mean
1.8x
3.4x
6.5x
5.6x
6.0x
7.7x
7.7x
Source: J.P. Morgan (describing figures as based on SNL Financial, FactSet and
company filings). Prices per share for dividend yield as of
February
3, 2012; all other data as per most recent publicly available GAAP results
For DX only, Excess Return
represents earnings retained and
not paid in a dividend |
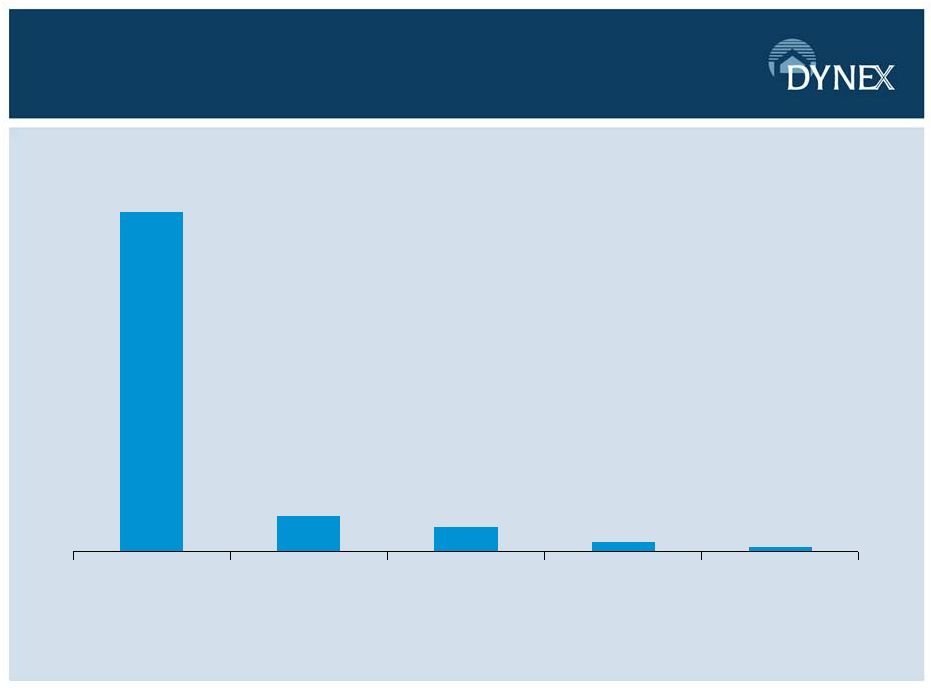
16
Insider Ownership Comparison
7.10%
0.75%
0.53%
0.21%
0.11%
DX
MFA
TWO
CIM
IVR
Source: Bloomberg |
17
Potential Investment Returns
(as of February 7, 2012)
Investment
Range of
prices
Range of
yields
Range of net
spread to
funding
Range of
ROEs
Agency RMBS
103-108
2.0%-
2.8%
1.5%-2.3%
12%-19%
Agency CMBS
103-115
2.9%-3.4%
1.3%-1.9%
14%-18%
Non-Agency A
AAA
RMBS
85-104
3.0%-8.5%
1.5%-4.0%
12%-20%
Non-Agency A-
AAA
CMBS
88-109
4.5%-6.0%
2.2%-3.9%
15%-19%
The above portfolio is for illustrative purposes only, does not represent actual or expected
performance and should not be relied upon for any investment decision. The range of
returns on equity is based on certain assumptions, including assumptions relating to asset allocation
percentages and spreads where mortgage assets can be acquired versus a current cost of funds
to finance acquisitions of those assets. Rates used represent a range of asset yields
and funding costs based on data available as of the date referenced above. Any change in the
assumed yields, funding costs or assumed leverage could materially alter the companys
returns. There can be no assurance that asset yields or funding costs will remain at
current levels. For a discussion of risks that may affect our ability to implement strategy and other factors
which may affect our potential returns, please see the section entitled Risk
Factors in our Annual Report on Form 10-K for the year ended December 31,
2010 and our Quarterly Reports on Form 10-Q for the quarters ended June 30, 2011 and September 30, 2011. |
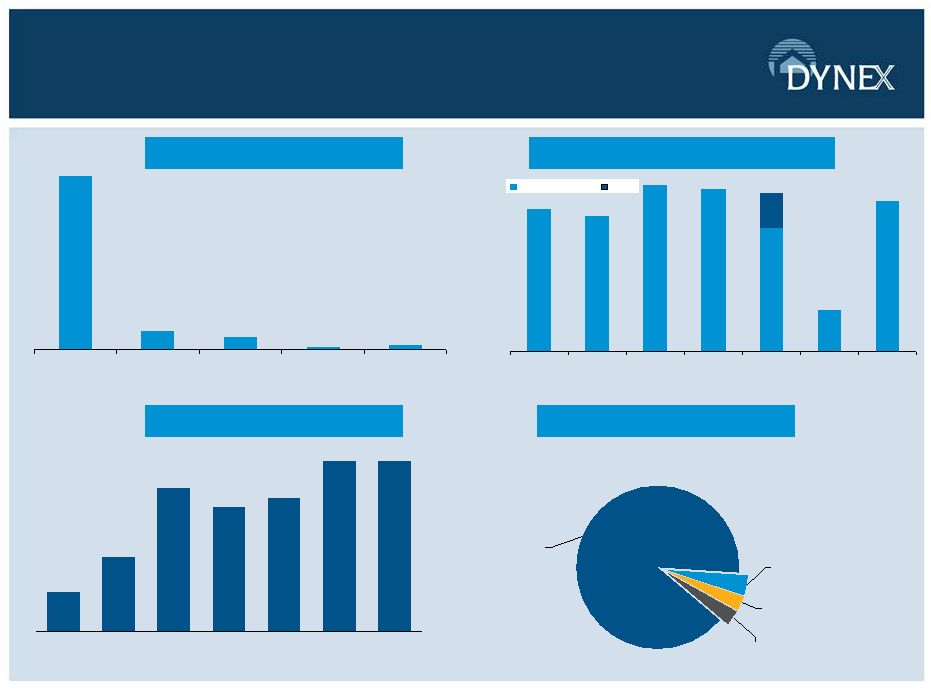
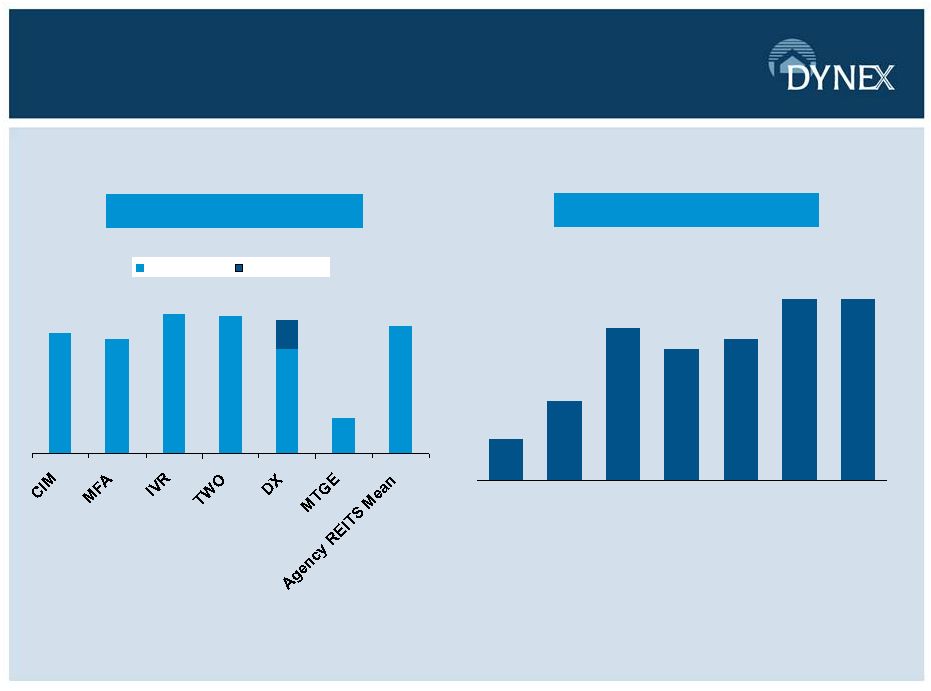
18
Why Dynex
6.94%
0.75%
0.53%
0.11%
0.21%
DX
MFA
TWO
IVR
CIM
High Insider Ownership
CIM
MFA
IVR
TWO
DX
MTGE
Agency
REITS
Mean
Low Debt-to-Equity
(1)
A
3%
Below A
3%
AA
4%
AAA
90%
High Credit Quality Portfolio
14.10%
14.9%
4.1%
12.2%
16.1%
16.4%
13.4%
3.40%
CIM
MFA
IVR
TWO
DX
MTGE
Agency
REITS
Mean
Dividend Yield
ROE
Competitive Returns
(1)
1.8x
3.4x
6.5x
5.6x
6.0x
7.7x
7.7x
(1) Source for non DX Info: J.P. Morgan (SNL
Financial, FactSet, Company filings), Market
data as of February 3, 2012. Financial data as per most recent available GAAP
results Source: Bloomberg
As of September 30,2011 |

19
19
Why Dynex
Excellent long term investment strategy driving solid performance record
Short-duration, high credit quality portfolio constructed to reduce exposure to
interest rate, prepayment, extension and credit risk
Balance sheet positioned to perform through volatile market environments
Experienced management with a track record of disciplined capital deployment
through multiple economic cycles
Alignment of interests with shareholders due to owner-operator structure
Complementary investment opportunities exist with attractive return profiles
consistent with our investment philosophy
Opportunistic capital raises have increased shareholder value |

20
APPENDIX |
21
21
Management Team
Thomas
B.
Akin
Chairman
and
Chief
Executive
Officer
33 years of experience in the industry and 8 years at Dynex
Chairman since 2003 and CEO since 2008
Managing Member of Talkot Capital, LLC
16 years at Merrill Lynch and Salomon Brothers
Byron
L.
Boston
Chief
Investment
Officer
28 years of experience in the industry with 4 years as CIO at Dynex
13 years managing levered multi-product portfolios at Freddie Mac and Sunset Financial
Resources
11 years trading MBS on Wall Street
3 years Senior Corporate Lending Officer at Chemical Bank
Stephen
J.
Benedetti
Chief
Financial
Officer
and
Chief
Operating
Officer
22 years of experience in the industry
Employed at Dynex for 17 years in various treasury, risk management and financial reporting
roles
Managed Dynex from 2002
2007
Began career at Deloitte & Touche
Portfolio Management Team
5 member team with a collective 65 years of industry experience with broad and deep skill sets
in both agency and non-agency investment strategies
Experienced team of professionals with a combined 83 years of experience
managing mortgage REITs and mortgage portfolios |

22
Capital Allocation
(as of September 30, 2011)
(1) Associated financing for investments includes repurchase agreements, securitization
financing issued to third parties and TALF financing (the latter two of which are
presented on the Companys balance sheet as non-recourse collateralized financing). Associated financing for hedging instruments represents the fair value
of the interest rate swap agreements in a liability position.
($ in millions)
Asset Carrying
Basis
Associated
Financing
(1)
/
Liability
Carrying Basis
Allocated
Shareholders'
Equity
Leverage
Target
Notes
$1,337.3 mm in Hybrid Agency ARMs
- Weighted average months-to-reset of 40 months
$358.7 mm in Agency ARMs
- Weighted average months-to-reset of 8 months
Agency CMBS
355.9
(251.3)
104.6
8x
Fixed rate agency CMBS
Voluntary prepayment protected
3Q 2011 weighted average annualized yield of 6.58%
~33% AAA and AA rated
3Q 2011 weighted average annualized yield of 6.03%
~74% AAA and AA rated
Loans pledged to support repayment of securitization
bonds issued by the Company
Originated in the 1990s
Unsecuritized single family and commercial mortgage
loans
Derivative
Instruments
-
(28.8)
(28.8)
-
Consists of interest rate swaps
Total
$2,595.4
($2,240.3)
$355.1
5 - 7x
6.1x actual leverage
-
1.0
-
(84.9)
33.8
2 - 3x
(322.8)
67.9
3 - 5x
$173.7
7 - 9x
2.9
4 - 5x
Agency RMBS
Non-Agency
RMBS
($1,542.5)
(10.0)
$1,716.2
12.9
118.7
1.0
Non-Agency
CMBS
Securitized
mortgage loans
Other investments
390.7 |
23
23
Selected Financial Highlights
(as of and for the quarter ended)
Financial Highlights:
($000 except per share amounts)
Sept 30, 2011
Jun 30, 2011
Mar 31, 2011
Dec 31, 2010
Sept 30, 2010
Total Investments
2,595,574
$
2,591,097
$
2,279,610
$
1,614,126
$
1,064,546
$
Total Assets
2,633,686
2,656,703
2,359,816
1,649,584
1,091,835
Total Liabilities
2,264,152
2,269,843
1,976,323
1,357,227
866,361
Total Equity
369,534
386,860
383,493
292,357
225,474
Interest Income
21,143
21,065
17,465
14,281
11,734
Interest Expense
6,583
6,032
4,734
3,385
3,333
Net Interest Income
14,560
15,033
12,731
10,896
8,401
General and Administrative Expenses
2,335
2,255
2,118
2,911
1,971
Net income
1,532
$
13,594
$
10,280
$
9,646
$
7,022
$
Diluted EPS
0.04*
0.34
$
0.31
$
0.40
$
0.33
$
Dividends declared per common share
0.27
0.27
0.27
0.27
0.25
$
Book Value per share
9.15
9.59
9.51
9.64
9.80
* Diluted EPS Ex-Items was $0.32. EPS Ex-Items, or Dynexs earnings per share excluding
certain items, excludes from GAAP earnings per share the impact of litigation settlement and
related defense costs of $8.2 million (or $0.20 per diluted common share), a loss of $2.0 million (or $0.05 per diluted common share) on redemption of non-recourse collateralized
financings, and $1.3 million (or $0.03 per diluted common share) in net accelerated premium
amortization due to an increase in forecasted prepayment speeds during the third quarter
of 2011. See the Companys press release issued November 1, 2011 for further discussion.
|
24
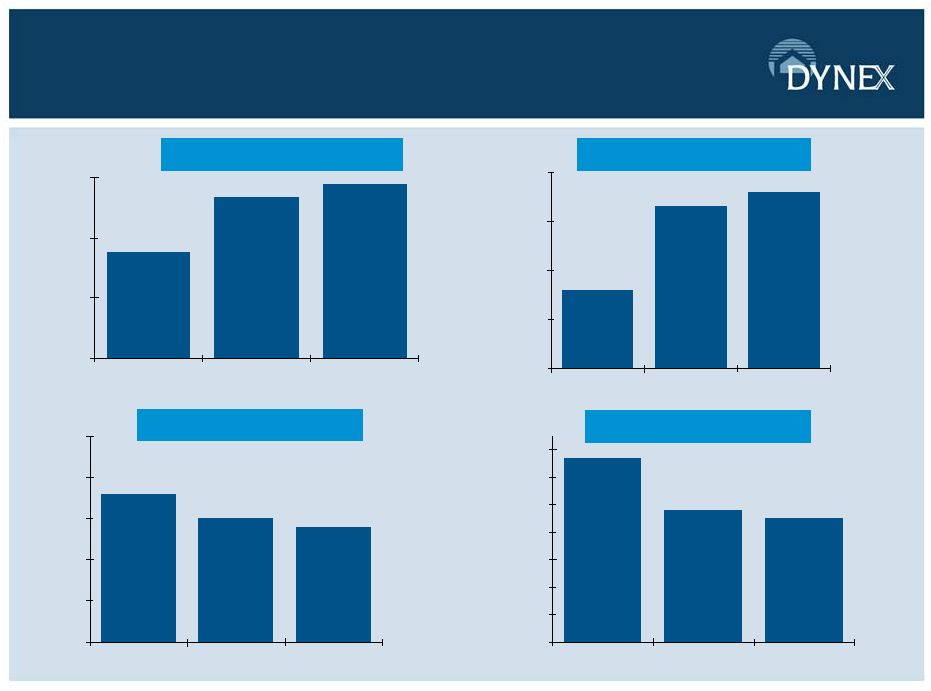
24
Key Prepayment Metrics
for Selected Agency RMBS Specified Pools
$269.0
$292.0
$297.0
$225.0
$250.0
$275.0
$300.0
DX
All ARMs
5/1 ARMs
Average Loan Size
41.0%
58.0%
61.0%
25.0%
35.0%
45.0%
55.0%
65.0%
DX
All ARMs
5/1 ARMs
Third Party Originated
18.0%
15.0%
14.0%
0.0%
5.0%
10.0%
15.0%
20.0%
25.0%
DX
All ARMs
5/1 ARMs
67.0%
48.0%
45.0%
0%
10%
20%
30%
40%
50%
60%
70%
DX
All ARMs
5/1 ARMs
Investor Property
Interest Only Loans
Source for Non-DX Metrics : J.P. Morgan
($ in thousands)
(as of September 30, 2011) |