INVESTOR PRESENTATION MATERIALS
Published on August 24, 2012
The
MoneyShow San Francisco Finding Yield in a
Zero Rate World
August 24, 2012
Exhibit 99.1 |

2
2
Safe Harbor Statement
NOTE:
This presentation contains certain statements that are not historical facts and that constitute forward-looking statements within the meaning of the Private
Securities Litigation Reform Act of 1995. Statements in this presentation addressing expectations,
assumptions, beliefs, projections, future plans, strategies, and events, developments that we
expect or anticipate will occur in the future, and future operating results or financial condition are forward-looking statements.
Forward-looking statements in this presentation may include, but are not limited to, statements
about projected future investment strategies and leverage ratios, future financial performance,
the projected impact of NOL carryforwards, future dividends paid to shareholders, and future investment opportunities and capital
raising activities. The words will, believe, expect,
forecast, anticipate, intend, estimate, assume,
project, plan, continue, and similar expressions also identify forward-looking
statements. These forward-looking statements reflect our current beliefs, assumptions and expectations based on information
currently available to us, and are applicable only as of the date of this presentation.
Forward-looking statements are inherently subject to risks, uncertainties, and other
factors, some of which cannot be predicted or quantified and any of which could cause the Companys actual results and timing of certain events to differ
materially from those projected in or contemplated by these forward-looking statements. Not all of
these risks, uncertainties and other factors are known to us. New risks and uncertainties arise
over time, and it is not possible to predict those risks or uncertainties or how they may affect us. The projections, assumptions,
expectations or beliefs upon which the forward-looking statements are based can also change as a
result of these risks and uncertainties or other factors. If such a risk, uncertainty, or other
factor materializes in future periods, our business, financial condition, liquidity and results of operations may differ materially from those
expressed or implied in our forward-looking statements.
While it is not possible to identify all factors, some of the factors that may cause actual results to
differ from historical results or from any results expressed or implied by our
forward-looking statements, or that may cause our projections, assumptions, expectations or beliefs to change, include the following: the risks and
uncertainties referenced in our Annual Report on Form 10-K for the year ended December 31, 2011 and subsequent filings with the Securities and Exchange
Commission, particularly those set forth under the caption
Risk Factors; our ability to find suitable reinvestment opportunities; changes in economic conditions;
changes in interest rates and interest rate spreads, including the repricing of interest-earnings
assets and interest-bearing liabilities; our investment portfolio performance particularly
as it relates to cash flow, prepayment rates and credit performance; the cost and availability of financing; the cost and availability of new
equity capital; changes in our use of leverage; the quality of performance of third-party service
providers of our loans and loans underlying our securities; the level of defaults by borrowers
on loans we have securitized; changes in our industry; increased competition; changes in government regulations affecting our business;
regulatory actions, if any, taken in connection with an SEC review of certain sections of the
Investment Company Act of 1940; government initiatives to support the U.S financial system and
U.S. housing and real estate markets; financial condition and future operations of the GSEs; GSE reform or other government policies
and actions; an ownership shift under Section 382 of the Internal Revenue Code that impacts the use of
our tax NOL carry forward; and our continued eligibility for inclusion in Russell Indexes and
the materiality of the income taxes which may be due to the Companys ownership of securities that generate excess inclusion
income.
|

Ways
Investors Can Find Yield: Indicated yields based on publicly available
information as of August 22, 2012. Actual yields may vary
substantially from the amounts indicated above 3
MLPs
~ 5%
Annuities
~ 4.5%
S&P 500
Equities
~ 2.1%
Treasury
Bonds
2 Yr ~.29%
MREITS
~ 10%+ |

4
Our Guiding Principles
Our Mission
Our Core Values
Generate dividends for shareholders
Manage leverage conservatively
Remain owner-operators
Maintain a culture of integrity and employ the highest ethical
standards
Provide a strong risk management culture
Focus on long-term shareholder value while preserving capital
Manage
a
successful
public
mortgage
REIT
with
a
focus
on
capital
preservation
and
providing
risk-adjusted
returns
reflective
of
a
diversified,
leveraged
fixed
income
portfolio. |

5
DX Snapshot
Market Highlights: (as of 8/20/12)
Common
Preferred
NYSE Stock Ticker:
DX
DXPrA
Shares Outstanding:
54,367,218
2,300,000
Dividends
Q2: $0.29
Annually: $2.125
Share Price:
$10.42
$25.58
Price to Book:
1.08x
Liquidation
Preference: $25
Market Capitalization:
$566.5 million
-
Large NOL
carryforward for
unique total
return
opportunity
Diversified
investment
strategy
investing in
residential and
commercial
mortgage assets
Significant
inside
ownership and
experienced
management
team
Internally
managed REIT
commenced
operations in
1988 |
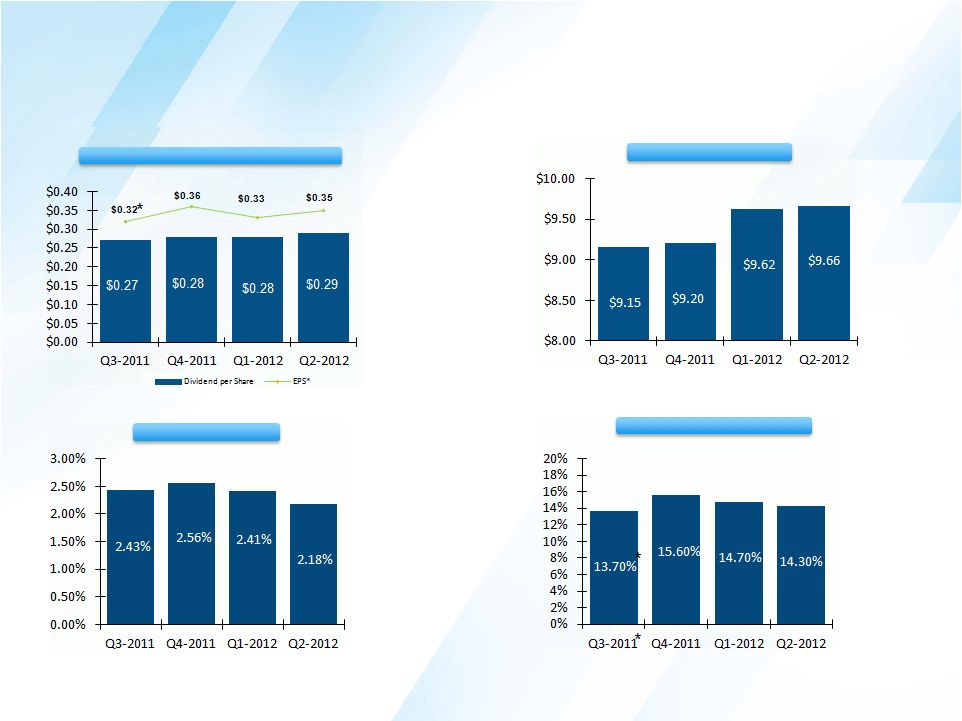
Summary of
Results Dividends and Earnings Per Share*
Book Value Per Share
Net Interest Spread
Return on Average Equity*
*As
presented
on
this
slide,
Q3-2011
earnings
per
share
and
return
on
average
equity
exclude
the
impact
of
certain
items
(EPS
Ex-Items).
EPS
Ex-Items
for
Q3-2011
excludes
from
GAAP
earnings
per
share
the
impact
of
litigation
settlement
and
related
defense
costs
of
$8.2
million
(or
$0.20
per
diluted
common
share),
a
loss
of
$2.0
million
(or
$0.05
per
diluted
common
share)
on
redemption
of
non-recourse
collateralized
financings,
and
$1.3
million
(or
$0.03
per
diluted
common
share)
in
net
accelerated
premium
amortization
due
to
an
increase
in
forecasted
prepayment
speeds
during
the
third
quarter
of
2011.
For
Q3-2011,
reported
diluted
EPS
was
$0.04
and
reported
annualized
ROAE
was
1.6%. |

Book Value
Growth Since 2008 $8.07
$9.08
$9.64
$9.20
$9.66
2008
2009
2010
2011
6/30/2012
7 |
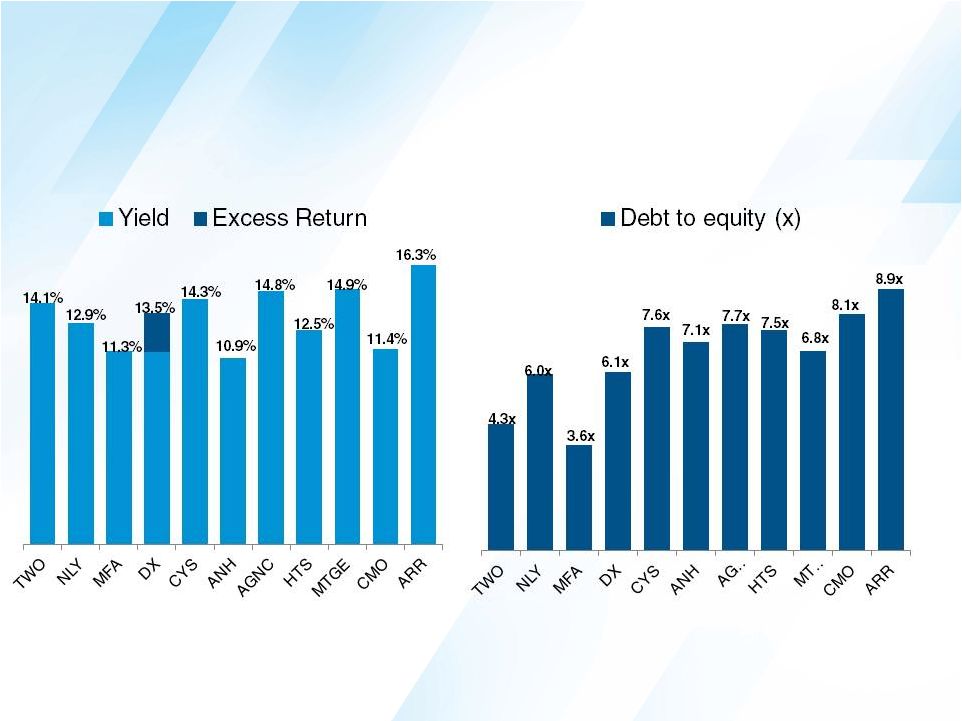
Trading
Comparables Yields
Portfolio Leverage
8
Source: J.P. Morgan and Company data
For DX, indicated yield is ROE for 2Q 2012 and for all others, indicated yield is
dividend yield as of 8/17/2012 |

9
Our Portfolio Strategy
OUR GOAL IS TO LIMIT CREDIT, INTEREST RATE,
PREPAYMENT, AND EXTENSION RISK IN OUR INVESTMENT
PORTFOLIO BY CONSTRUCTING A PORTFOLIO WITH:
Agency and Non-Agency Securities
Short Duration Assets
High Credit Quality
Prepayment Protection
Low Leverage |
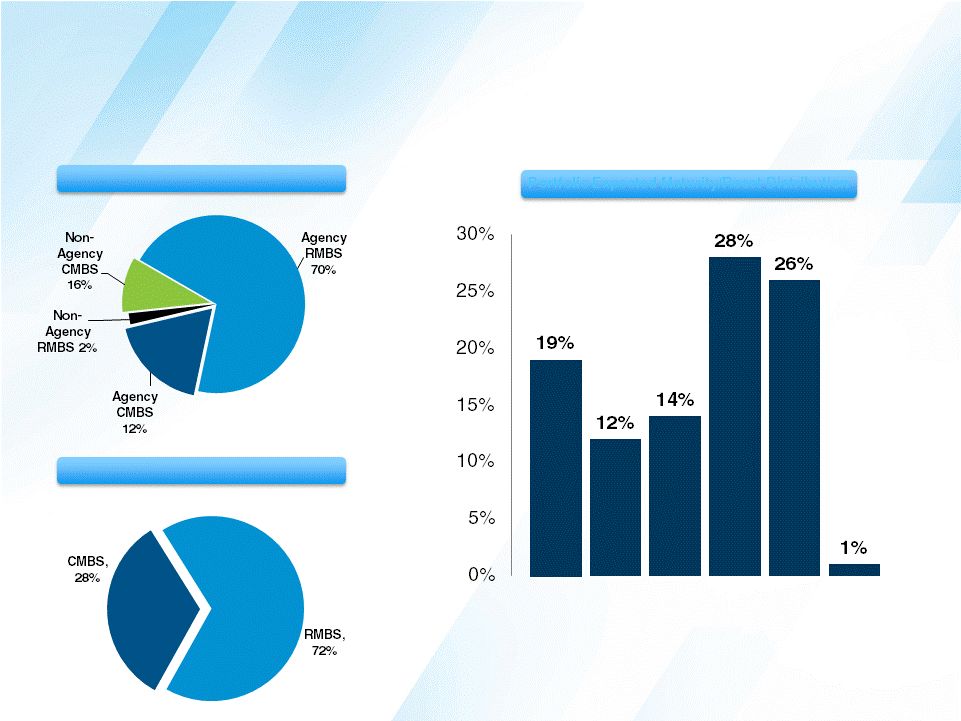
10
DX Investment Portfolio
(as of June 30, 2012)
<15 16-40
41-60 61-84 85-120 120-125
Months to Maturity/Reset
Agency/Non-Agency
Portfolio Expected Maturity/Reset Distribution
Residential/Commercial |
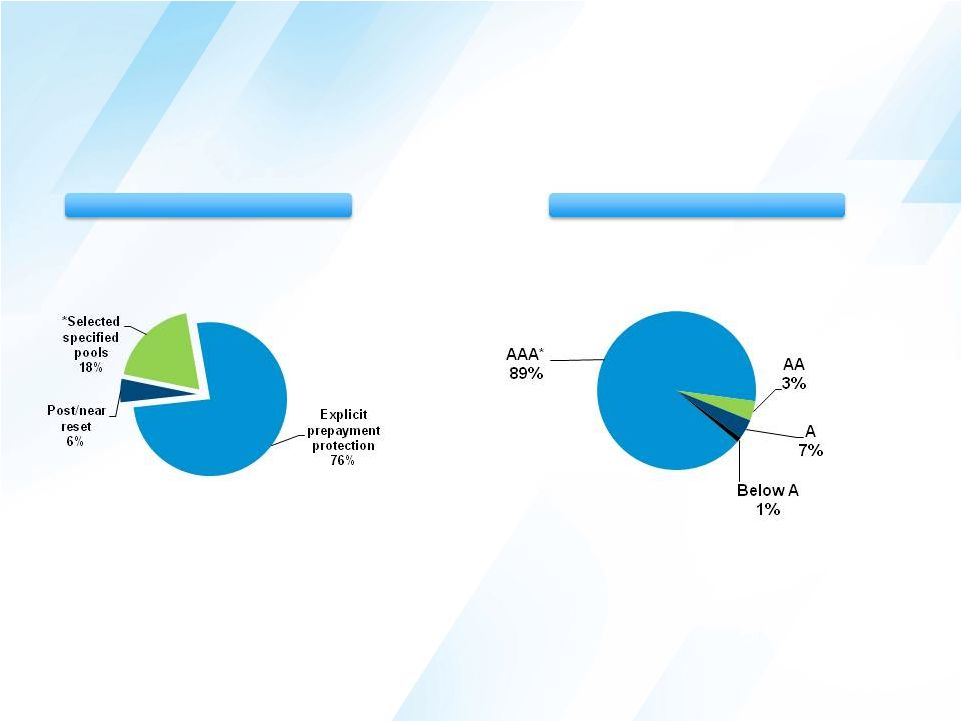
DX Portfolio
Detail (as of June 30, 2012)
11
*Agency MBS are considered AAA rated as of the date presented
Dollar Prepayment Premium Exposure
Credit Quality |

CMBS
Portfolio (as of June 30, 2012)
12
Asset Type
By year of origination
$
in millions
$
in millions
*Agency CMBS are considered AAA-rated as of the date presented
Credit Quality
Non-Agency Vintage
Collateral |
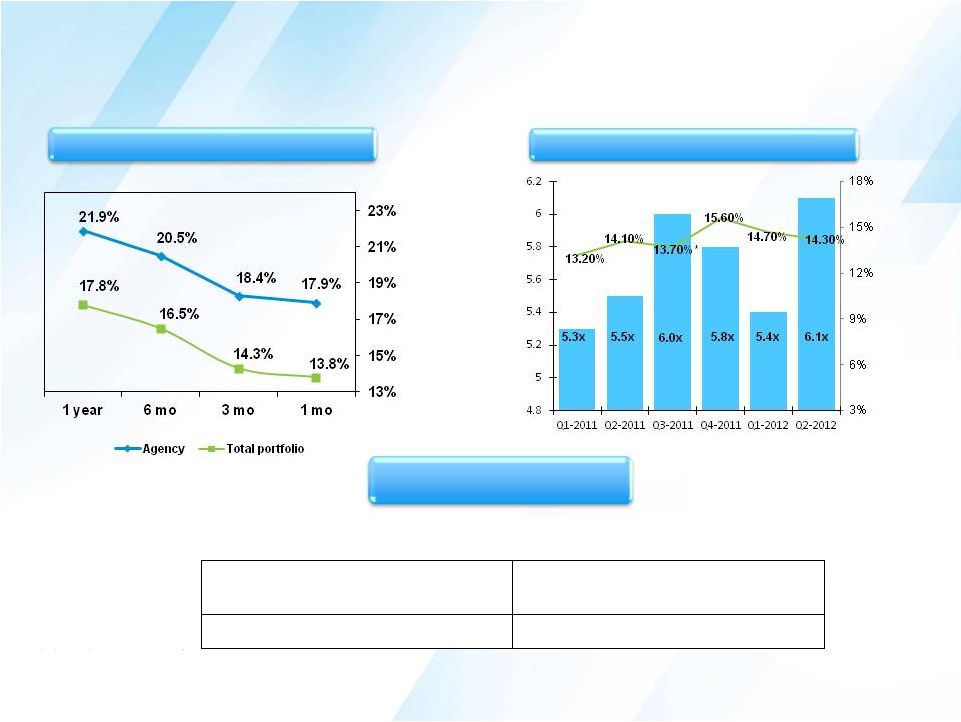
Portfolio
Performance *As
presented
on
this
slide,
Q3-2011
return
on
average
equity
is
calculated
based
on
a
measure
that
excludes
the
impact
of
certain
items
on
earnings
per
share
(EPS
Ex-Items).
EPS
Ex-Items
for
Q3-2011
was
$0.32 and excludes from GAAP earnings per share the impact of litigation settlement
and related defense costs of $8.2 million (or $0.20 per diluted common share), a loss of $2.0 million (or $0.05 per diluted
common
share)
on
redemption
of
non-recourse
collateralized
financings,
and
$1.3
million
(or
$0.03
per
diluted
common
share)
in
net
accelerated
premium
amortization
due
to
an
increase
in
forecasted
prepayment
speeds during the third quarter of 2011. For Q3-2011, reported diluted EPS was
$0.04 and reported annualized ROAE was 1.6%. (as of June 30,
2012) Net Interest Spread
(quarter ended)
Prepayment Performance
Leverage and ROE
June 30, 2012
March 31, 2012
Agency
Non-Agency
Portfolio
Agency
Non-Agency
Portfolio
2.75%
6.05%
3.29%
2.98%
6.49%
3.58%
(0.88%)
(2.55%)
(1.11%)
(0.91%)
(2.52%)
(1.17%)
1.87%
3.50%
2.18%
2.07%
3.97%
2.41%
Investment Yield
Cost of funds
Net interest spread |
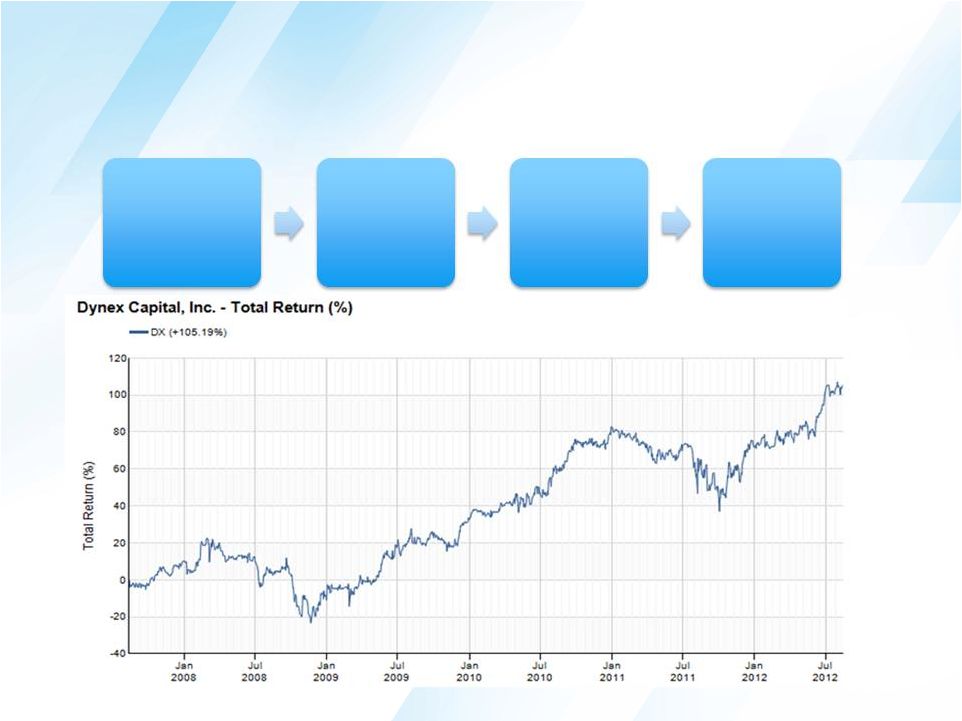
14
Dynex Value Proposition
Source: SNL
+105.19%
Internally
Managed and
Publicly Traded
Since 1988
Diversified
Investment
Strategy
Large Tax
NOL
Significant
Insider
Ownership |

15
APPENDIX |


16
Capital Allocation (as of June 30, 2012)
(1) At June 30, 2012, associated financing for investments includes repurchase
agreements, and securitization financing issued to third parties (the latter of which are presented on the Companys balance
sheet as non-recourse
collateralized financing). Associated financing for hedging instruments represents the fair value of the interest rate swap agreements in a liability position.
($ in millions)
Asset Carrying
Basis
Associated
Financing
(1)
/
Liability
Carrying Basis
Allocated
Shareholders'
Equity
Leverage
Target
Notes
$1,715.0 in Hybrid Agency ARMs
- Weighted average months-to-reset of 65 months
$552.2 in Agency ARMs
- Weighted average months-to-reset of 8 months
Agency CMBS
328.8
(225.0)
103.7
8x
Weighted average months-to-maturity of 102
Voluntary prepayment protected
Agency CMBS IO
299.9
(243.7)
56.2
3 - 4x
Weighted average months-to-maturity of 100 months
Non-Agency RMBS
18.1
(14.6)
3.5
4 - 5x
2Q 2012 weighted average annualized yield of 5.60%
~43% AAA and AA rated
Non-Agency CMBS
2Q 2012 weighted average annualized yield of 5.81%
~47% AAA and AA rated
Non-Agency CMBS IO
66.0
(51.1)
14.9
3 - 4x
2Q 2012 weighted average annualized yield of 7.64%
100% "AAA" and "AA" rated
Loans pledged to support repayment of securitization
bonds issued by the Company
Originated in the 1990s
Unsecuritized single family and commercial mortgage
loans
Derivative Instruments
0.0
(39.3)
(39.3)
-
Consists of interest rate swaps
Cash and cash equivalents
53.8
0.0
53.8
-
Other assets/other liabilities
47.3
(20.9)
26.4
-
Total
$3,729.2
($3,204.1)
$525.1
6-7x
0.0
0.9
-
(57.7)
31.5
3 - 4x
($2,162.5)
$2,350.4
(389.3)
85.6
3 - 4x
$187.9
8 - 9x
89.2
0.9
Securitized mortgage loans
Other investments
474.9
Agency RMBS |

17
17
Selected Financial Highlights
(as of and for the quarter ended)
Financial Highlights:
($000 except per share amounts)
Jun 30, 2012
Mar 31, 2012
Dec 31, 2011
Sept 30, 2011
Jun 30, 2011
Total Investments
3,628,163
$
3,276,170
$
2,500,976
$
2,595,574
$
2,591,097
$
Total Assets
3,729,197
3,349,056
2,582,193
2,633,686
2,656,703
Total Liabilities
3,204,124
2,826,159
2,210,844
2,264,152
2,269,843
Total Equity
525,073
522,897
371,349
369,534
386,860
Interest Income
27,125
26,272
23,704
21,143
21,065
Interest Expense
8,117
7,125
6,732
6,583
6,032
Net Interest Income
19,008
19,147
16,972
14,560
15,033
General and Administrative Expenses
3,024
3,121
3,249
2,335
2,255
Net Income
18,847
$
16,476
$
14,406
$
1,532
$
13,594
$
Diluted EPS
0.35
$
0.33
$
0.36
$
0.04
$
0.34
$
Dividends Declared per Common Share
0.29
0.28
0.28
0.27
0.27
Book Value per Share
9.66
9.62
9.20
9.15
9.59
* Diluted
EPS
Ex-Items
was
$0.32.
EPS
Ex-Items,
or
Dynexs
earnings
per
share
excluding
certain
items,
excludes
from
GAAP
earnings
per
share
the
impact
of
litigation
settlement
and
related
defense
costs
of
$8.2
million
(or
$0.20
per
diluted
common
share),
a
loss
of
$2.0
million
(or
$0.05
per
diluted
common
share)
on
redemption
of
non-recourse
collateralized
financings,
and
$1.3
million
(or
$0.03
per
diluted
common share) in net accelerated premium amortization due to an increase in
forecasted prepayment speeds during the third quarter of 2011. See the Companys press release issued November 1, 2011 for
further discussion.
* |