EXHIBIT 99.1
Published on March 26, 2013
Exhibit 99.1
Investor Presentation
March 26 27, 2013
Safe Harbor Statement
NOTE:
This presentation contains certain statements that are not historical facts and that constitute forward-looking statements within the meaning of the Private Securities Litigation Reform Act of 1995. Statements in this presentation addressing expectations, assumptions, beliefs, projections, future plans, strategies, and events, developments that we expect or anticipate will occur in the future, and future operating results or financial condition are forward-looking statements. Forward-looking statements in this presentation may include, but are not limited to statements about projected future investment strategies and leverage ratios, future financial performance, the projected impact of NOL carryforwards, future dividends paid to shareholders, and future investment opportunities and capital raising activities. The words will, believe, expect, forecast, anticipate, intend, estimate, assume, project, plan, continue, and similar expressions also identify forward-looking statements. These forward-looking statements reflect our current beliefs, assumptions and expectations based on information currently available to us, and are applicable only as of the date of this presentation. Forward-looking statements are inherently subject to risks, uncertainties, and other factors, some of which cannot be predicted or quantified and any of which could cause the Companys actual results and timing of certain events to differ materially from those projected in or contemplated by these forward-looking statements. Not all of these risks, uncertainties and other factors are known to us. New risks and uncertainties arise over time, and it is not possible to predict those risks or uncertainties or how they may affect us. The projections, assumptions, expectations or beliefs upon which the forward-looking statements are based can also change as a result of these risks and uncertainties or other factors. If such a risk, uncertainty, or other factor materializes in future periods, our business, financial condition, liquidity and results of operations may differ materially from those expressed or implied in our forward-looking statements.
While it is not possible to identify all factors, some of the factors that may cause actual results to differ from historical results or from any results expressed or implied by our forward-looking statements, or that may cause our projections, assumptions, expectations or beliefs to change, include the following: the risks and uncertainties referenced in our Annual Report on Form 10-K for the year ended December 31, 2012 and subsequent filings with the Securities and Exchange Commission, particularly those set forth under the caption Risk Factors; our ability to find suitable reinvestment opportunities; changes in economic conditions; changes in interest rates and interest rate spreads, including the repricing of interest-earnings assets and interest-bearing liabilities; our investment portfolio performance particularly as it relates to cash flow, prepayment rates and credit performance; the cost and availability of financing; the cost and availability of new equity capital; changes in our use of leverage; the quality of performance of third-party service providers of our loans and loans underlying our securities; the level of defaults by borrowers on loans we have securitized; changes in our industry; increased competition; changes in government regulations affecting our business; regulatory actions, if any, taken in connection with an SEC review of certain sections of the Investment Company Act of 1940; government initiatives to support the U.S financial system and U.S. housing and real estate markets; financial condition and future operations of the GSEs; GSE reform or other government policies and actions; the impact of our ownership shift under Section 382 of the Internal Revenue Code on our use of our tax NOL carryforward; and our continued eligibility for inclusion in Russell Indexes and the materiality of the income taxes which may be due to the Companys ownership of securities that generate excess inclusion income.
2
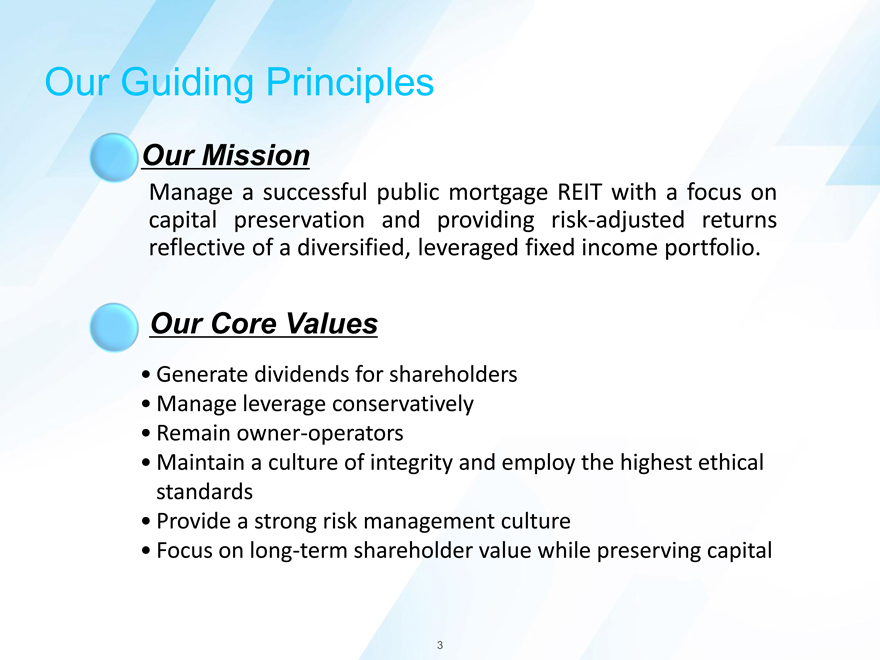
Our Guiding Principles
Our Mission
Manage a successful public mortgage REIT with a focus on capital preservation and providing risk-adjusted returns reflective of a diversified, leveraged fixed income portfolio.
Our Core Values
Generate dividends for shareholders
Manage leverage conservatively
Remain owner-operators
Maintain a culture of integrity and employ the highest ethical standards
Provide a strong risk management culture
Focus on long-term shareholder value while preserving capital
3
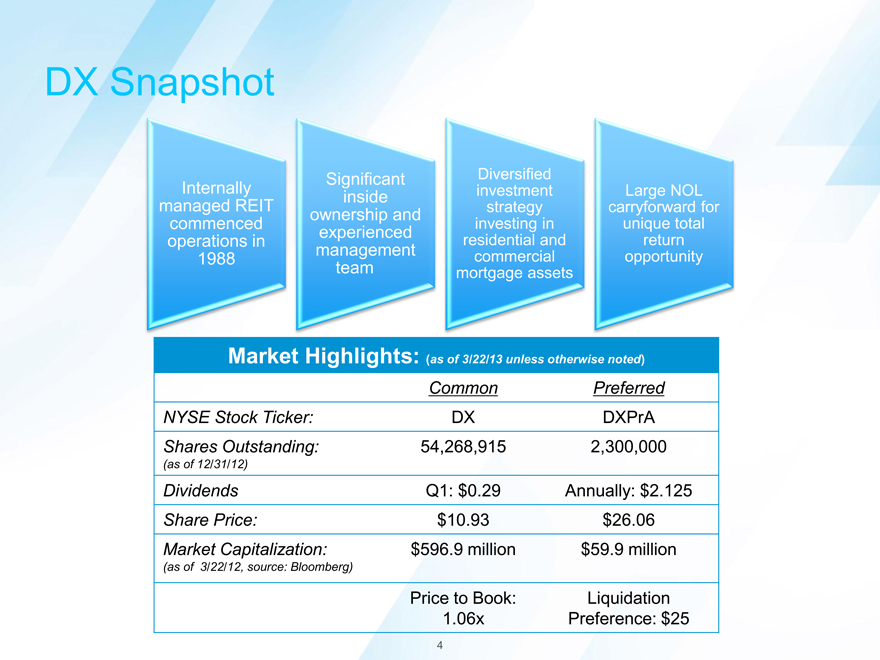
DX Snapshot
Significant Diversified
Internally investment Large NOL inside managed REIT strategy carryforward for ownership and commenced investing in unique total experienced operations in residential and return management commercial opportunity
1988 team mortgage assets
Market Highlights: (as of 3/22/13 unless otherwise noted)
Common Preferred NYSE Stock Ticker: DX DXPrA Shares Outstanding: 54,268,915 2,300,000
(as of 12/31/12)
Dividends Q1: $0.29 Annually: $2.125
Share Price: $10.93 $26.06
Market Capitalization: $596.9 million $59.9 million
(as of 3/22/12, source: Bloomberg)
Price to Book: Liquidation 1.06x Preference: $25
4
Fourth Quarter 2012 Highlightsp
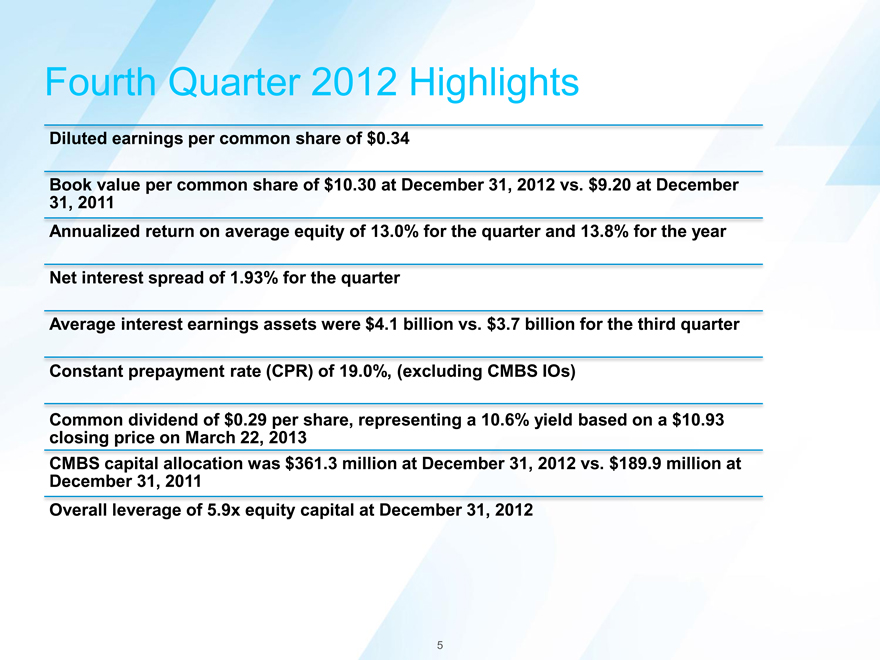
Diluted earnings per common share of $0.34
Book value per common share of $10.30 at December 31, 2012 vs. $9.20 at December 31, 2011 Annualized return on average equity of 13.0% for the quarter and 13.8% for the year
Net interest spread of 1.93% for the quarter
Average interest earnings assets were $4.1 billion vs. $3.7 billion for the third quarter
Constant prepayment rate (CPR) of 19.0%, (excluding CMBS IOs)
Common dividend of $0.29 per share, representing a 10.6% yield based on a $10.93 closing price on March 22, 2013 CMBS capital allocation was $361.3 million at December 31, 2012 vs. $189.9 million at December 31, 2011 Overall leverage of 5.9x equity capital at December 31, 2012
5
Summary of Results
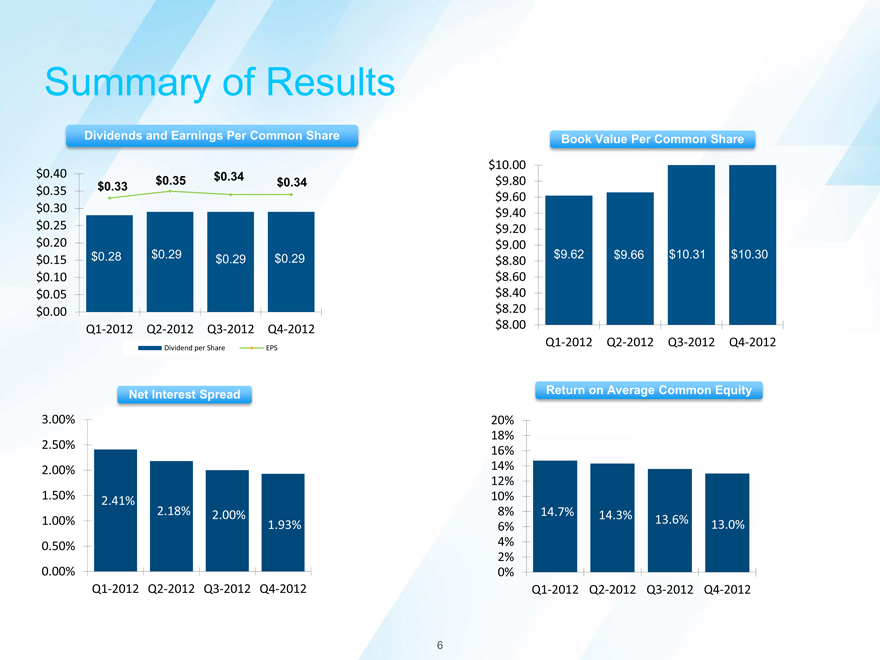
Dividends and Earnings Per Common Share
$0.40 $0.35 $0.30 $0.25 $0.20 $0.15 $0.10 $0.05 $0.00
$0.35 $0.34 $0.33 $0.34
$0.28 $0.29 $0.29 $0.29
Q1-2012 Q2-2012 Q3-2012 Q4-2012
Dividend per Share
EPS
Net Interest Spread
3.00% 2.50% 2.00% 1.50% 1.00% 0.50% 0.00%
2.41% 2.18%
2.00% 1.93%
Q1-2012 Q2-2012 Q3-2012 Q4-2012
Book Value Per Common Share
$10.00 $9.80 $9.60 $9.40 $9.20 $9.00 $8.80 $8.60 $8.40 $8.20 $8.00
$9.62 $9.66 $10.31 $10.30
Q1-2012 Q2-2012 Q3-2012 Q4-2012
Return on Average Common Equity
20% 18% 16% 14% 12% 10% 8% 6% 4% 2% 0%
Q1-2012 Q2-2012 Q3-2012 Q4-2012
14.7% 14.3%
$$/BREAK/$$END
13.6% 13.0%
6
Consistent Core Investment Strategy
Short High Low Diversified
Duration Quality Leverage
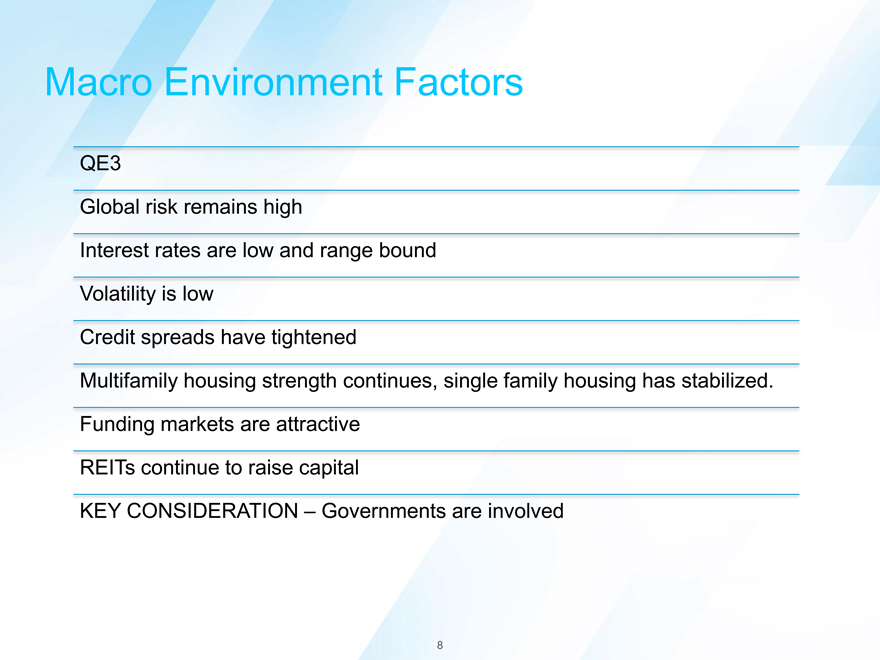
Macro Environment Factors
QE3
Global risk remains high
Interest rates are low and range bound Volatility is low Credit spreads have tightened
Multifamily housing strength continues, single family housing has stabilized. Funding markets are attractive REITs continue to raise capital KEY CONSIDERATION Governments are involved
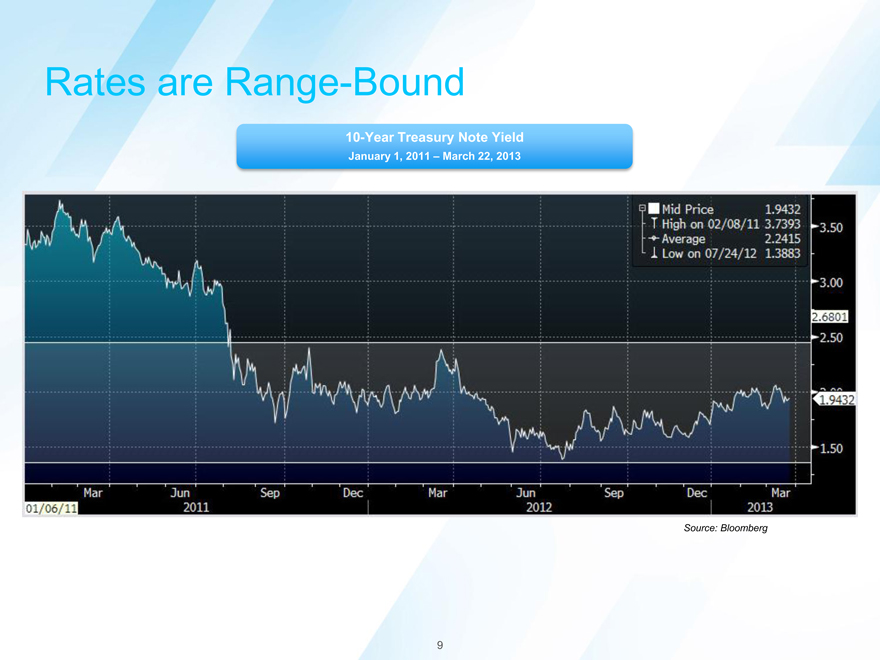
Rates are Range-Bound
10-Year Treasury Note Yield
January 1, 2011 March 22, 2013
Source: Bloomberg
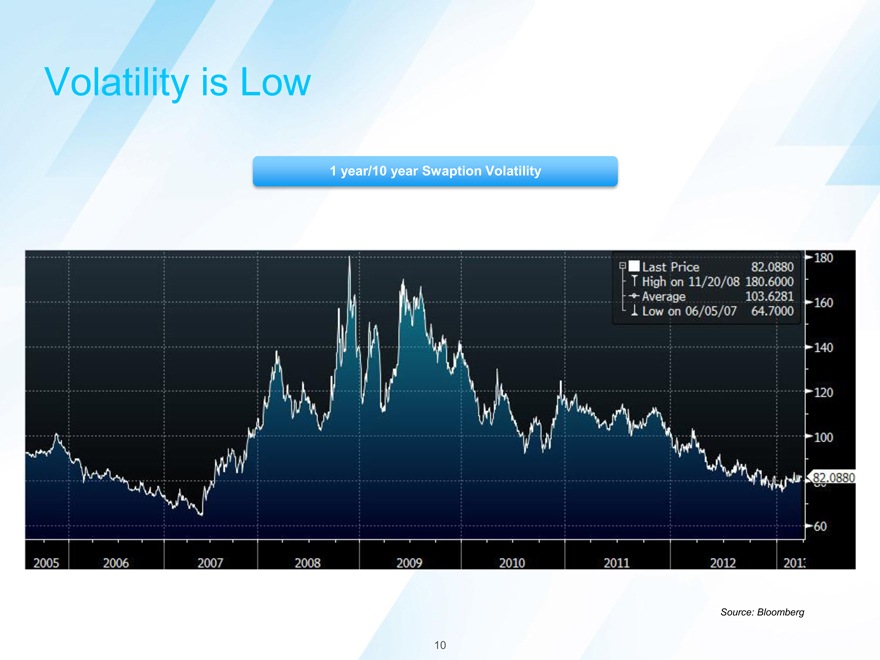
Volatility is Low
1 year/10 year Swaption Volatility
Source: Bloomberg
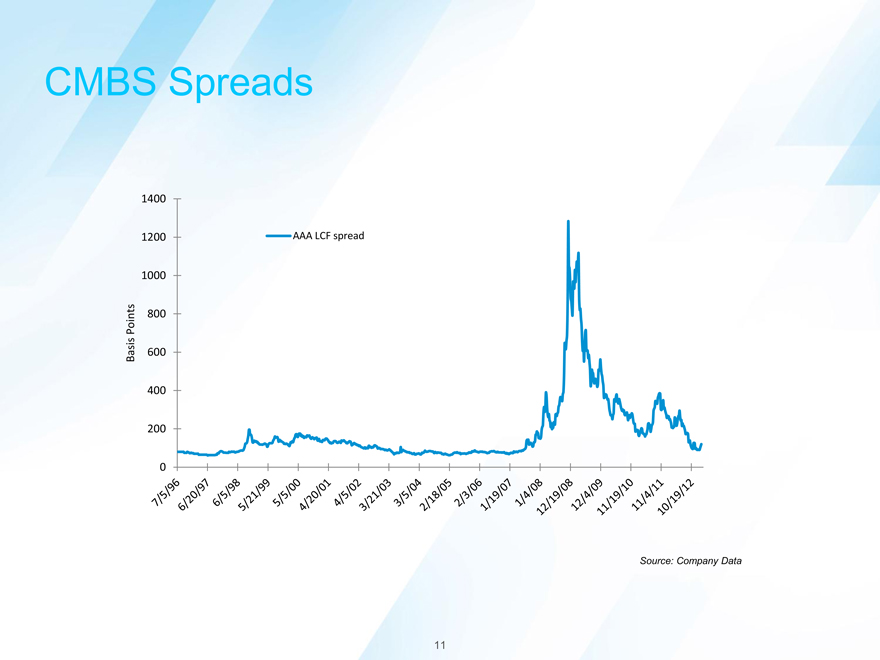
CMBS Spreads
AAA LCF spread
1400 1200 1000
Points 800 Basis 600 400
200
0
Source: Company Data
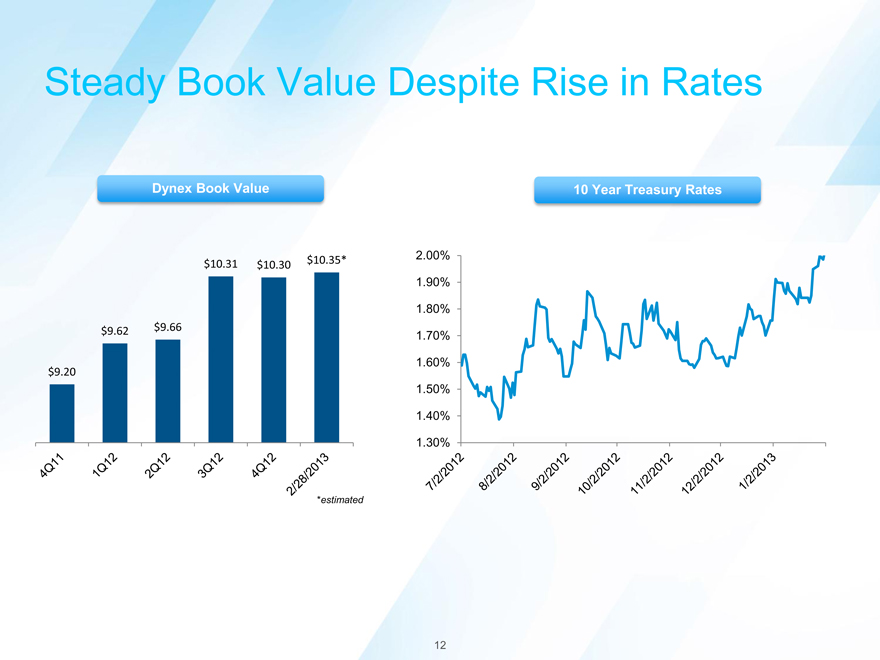
Steady Book Value Despite Rise in Rates
Dynex Book Value 10 Year Treasury Rates
$10.31 $10.35* $10.30
$9.62 $9.66
$9.20
*estimated
2.00% 1.90% 1.80% 1.70% 1.60% 1.50% 1.40% 1.30%
12
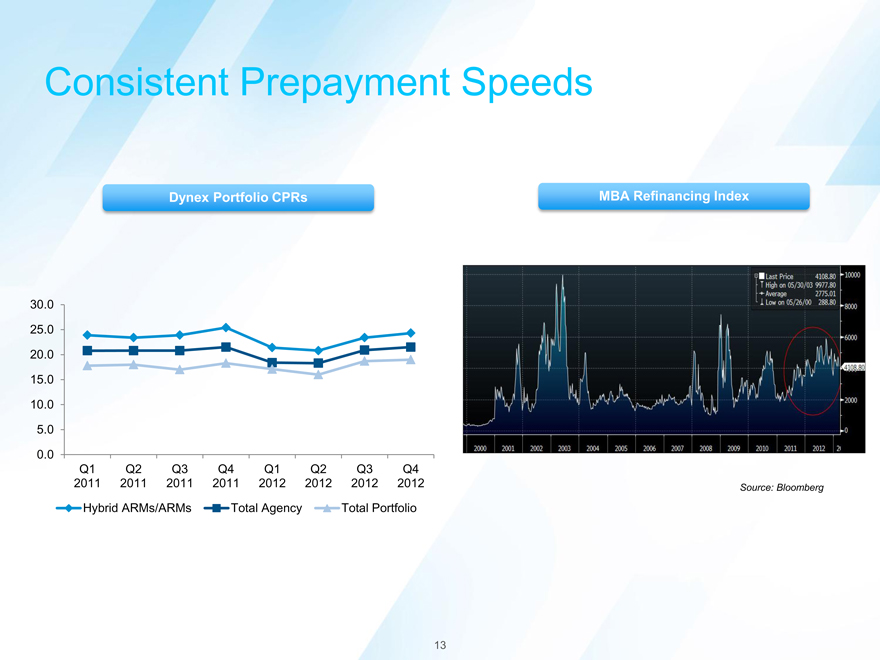
Consistent Prepayment Speeds
Dynex Portfolio CPRs MBA Refinancing Index
30.0
25.0
20.0 15.0 10.0 5.0 0.0
Q1 Q2 Q3 Q4 Q1 Q2 Q3 Q4 2011 2011 2011 2011 2012 2012 2012 2012
Hybrid ARMs/ARMs
Total Agency
Total Portfolio
Source: Bloomberg
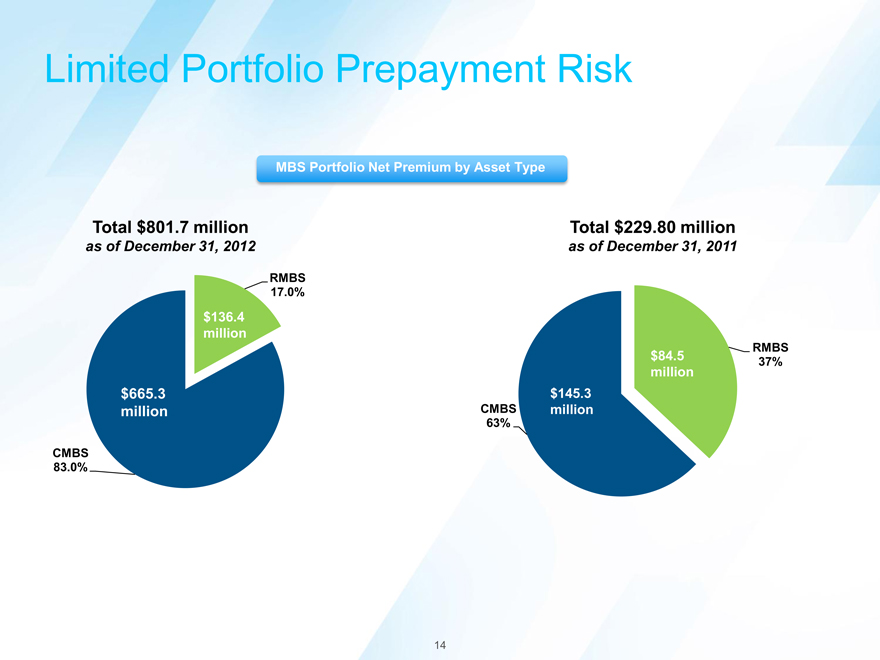
Limited Portfolio Prepayment Risk
MBS Portfolio Net Premium by Asset Type
Total $801.7 million Total $229.80 million
as of December 31, 2012 as of December 31, 2011
RMBS 17.0%
CMBS 83.0%
$665.3 million
$136.4 million
RMBS 37%
$84.5 million $145.3 CMBS million
63%
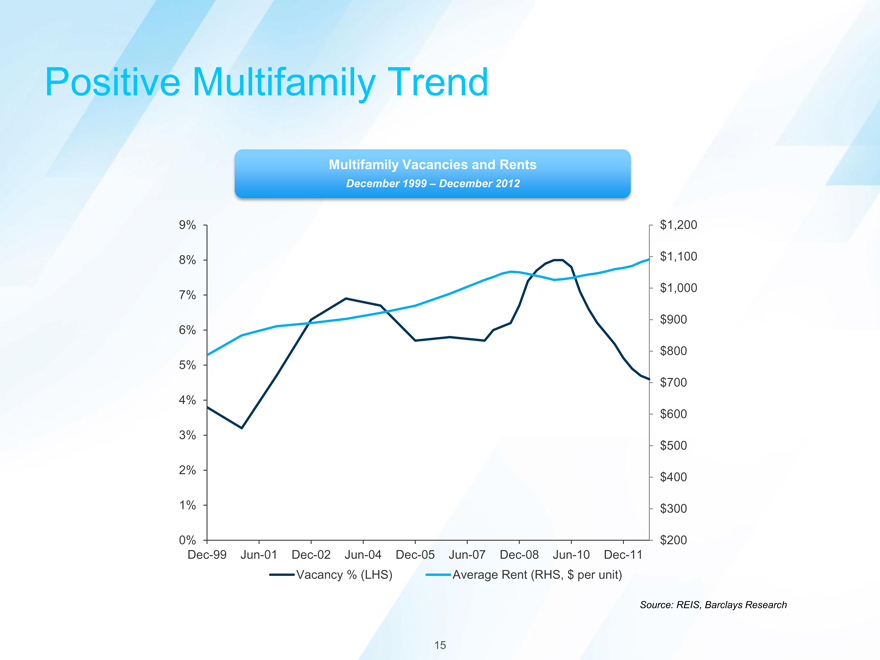
Positive Multifamily Trend
Multifamily Vacancies and Rents
December 1999 December 2012
9% 8% 7% 6% 5% 4% 3% 2%
1%
0%
Dec-99 Jun-01 Dec-02 Jun-04 Dec-05 Jun-07 Dec-08 Jun-10 Dec-11
Vacancy % (LHS) Average Rent (RHS, $ per unit)
$1,200 $1,100 $1,000 $900 $800 $700 $600 $500 $400 $300 $200
Source: REIS, Barclays Research
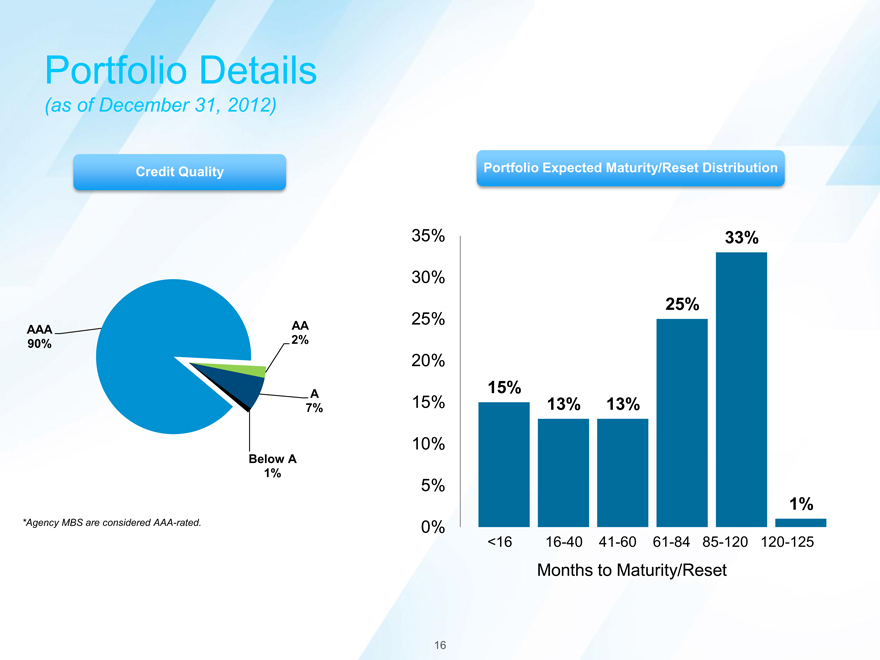
Portfolio Details
(as of December 31, 2012)
Credit Quality Portfolio Expected Maturity/Reset Distribution
35% 33%
30%
25% 25% 20% 15% 15%
13% 13%
10%
5%
1%
0%
<16 16-40 41-60 61-84 85-120 120-125
Months to Maturity/Reset
AAA AA 90% 2%
A 7%
Below A 1%
*Agency MBS are considered AAA-rated.
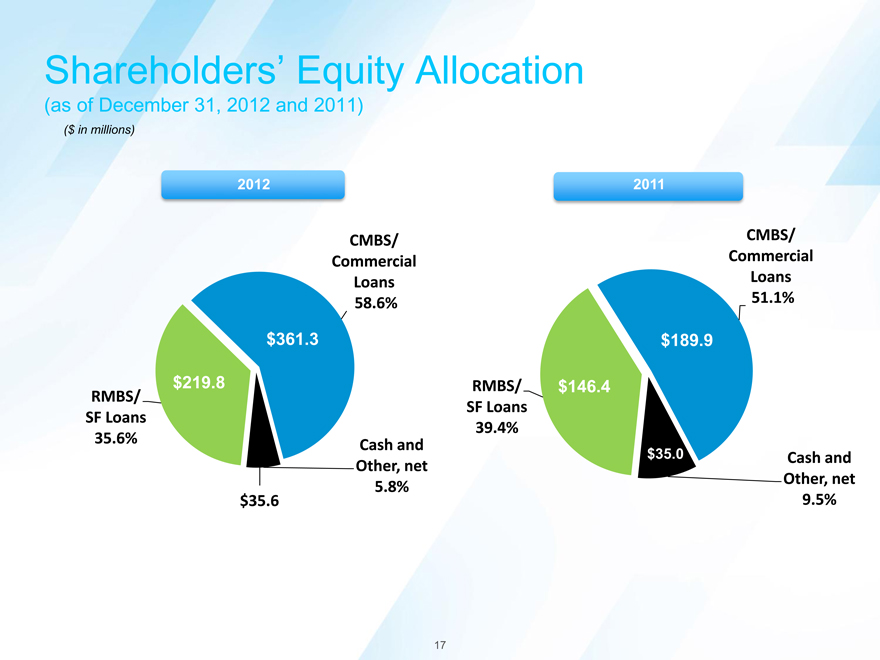
Shareholders Equity Allocation
(as of December 31, 2012 and 2011)
($ in millions)
2012 2011
CMBS/ CMBS/ Commercial Commercial Loans Loans 58.6% 51.1% $361.3 $189.9
RMBS/ $219.8 RMBS/ $146.4
SF Loans SF Loans 39.4% 35.6% Cash and $35.0 Cash and Other, net Other, net
5.8% 9.5% $35.6
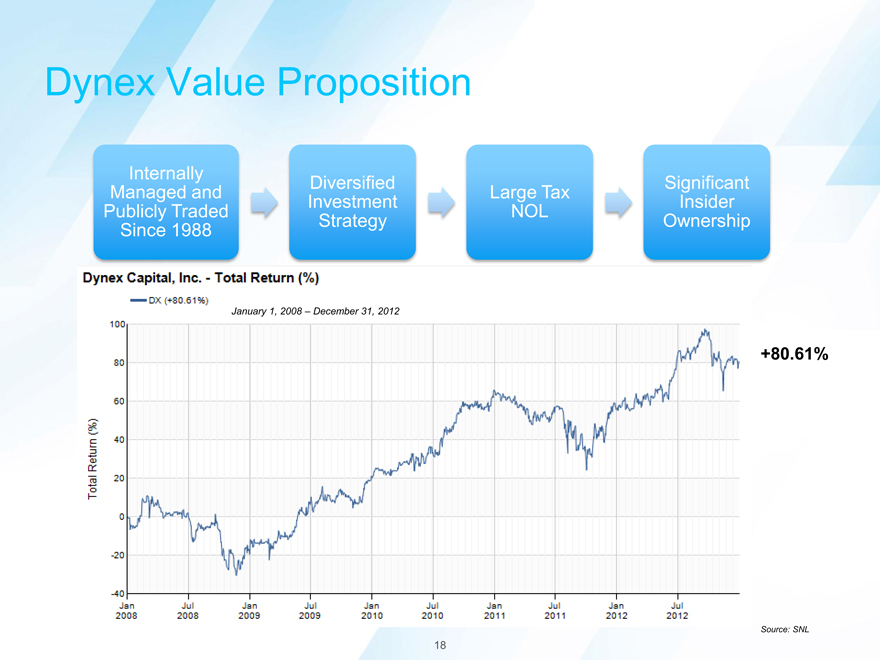
Dynex Value Proposition
Internally
Diversified Significant Managed and Large Tax Investment Insider Publicly Traded NOL
Strategy Ownership
Since 1988
January 1, 2008 December 31, 2012
+80.61%
Source: SNL
Summary
Diversified investment strategy
Business model provides options to take advantage of selective opportunities and deliver returns in the future Prepayment risk is mitigated by majority of capital allocation to CMBS, which is explicitly prepayment protected Anticipated modest monthly reinvestment needs of ~$40-$80 million
Current investment portfolio supports the dividend policy
As owner operators, we are focused on long-term shareholder value
19
APPENDIX
20
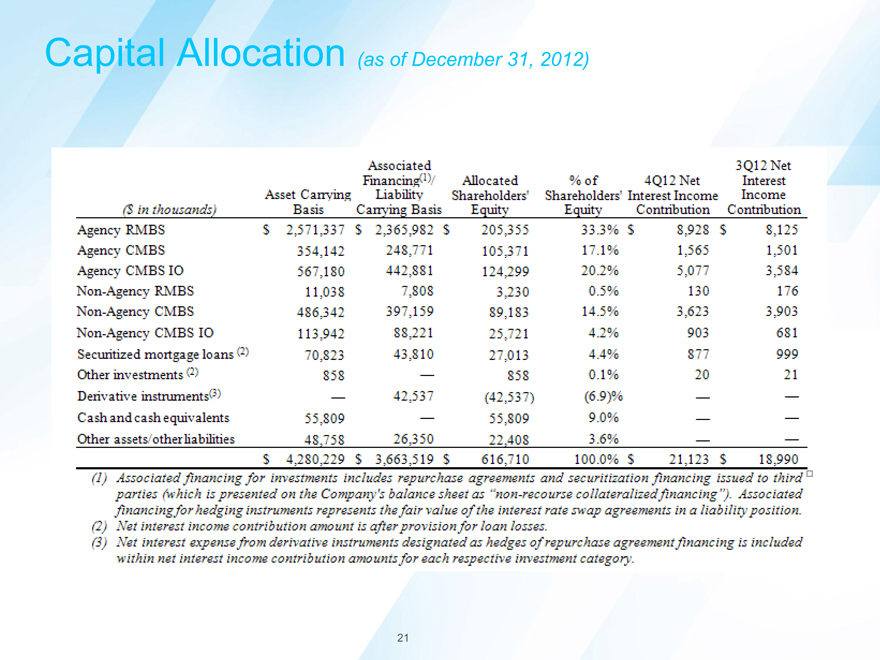
Capital Allocation (as of December 31, 2012)
21
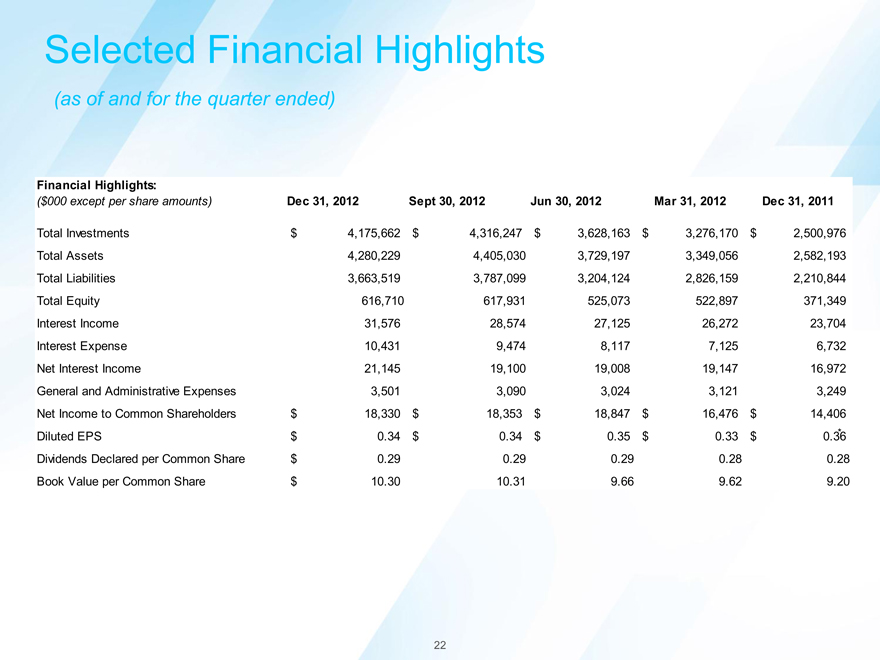
Selected Financial Highlights
(as of and for the quarter ended)
Financial Highlights:
($000 except per share amounts) Dec 31, 2012 Sept 30, 2012 Jun 30, 2012 Mar 31, 2012 Dec 31, 2011
Total Investments $ 4,175,662 $ 4,316,247 $ 3,628,163 $ 3,276,170 $ 2,500,976 Total Assets 4,280,229 4,405,030 3,729,197 3,349,056 2,582,193 Total Liabilities 3,663,519 3,787,099 3,204,124 2,826,159 2,210,844 Total Equity 616,710 617,931 525,073 522,897 371,349 Interest Income 31,576 28,574 27,125 26,272 23,704 Interest Expense 10,431 9,474 8,117 7,125 6,732 Net Interest Income 21,145 19,100 19,008 19,147 16,972 General and Administrative Expenses 3,501 3,090 3,024 3,121 3,249 Net Income to Common Shareholders $ 18,330 $ 18,353 $ 18,847 $ 16,476 $ 14,406 Diluted EPS $ 0.34 $ 0.34 $ 0.35 $ 0.33 $ 0.36 *
Dividends Declared per Common Share $ 0.29 0.29 0.29 0.28 0.28 Book Value per Common Share $ 10.30 10.31 9.66 9.62 9.20
22
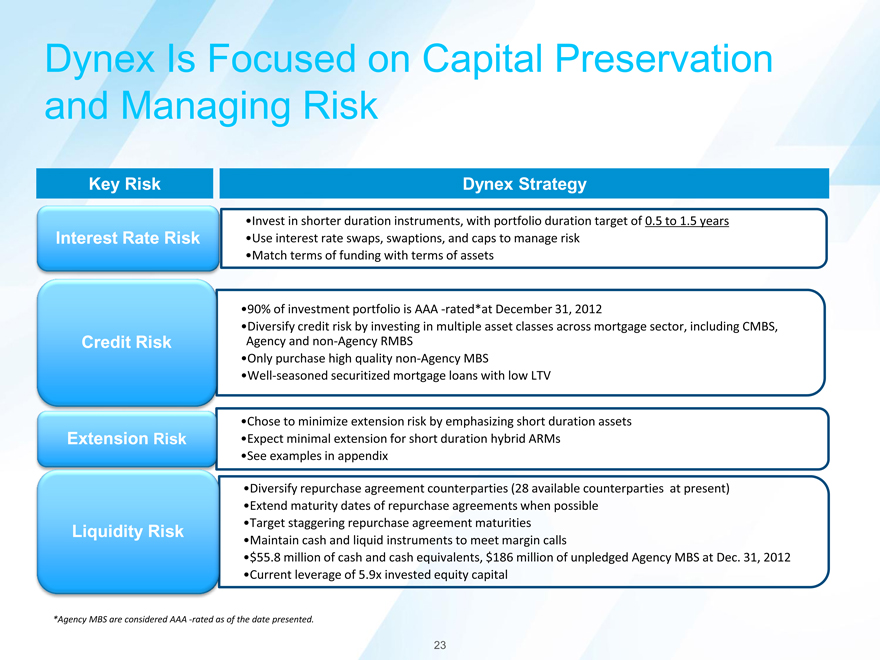
Dynex Is Focused on Capital Preservation and Managing Risk
Key Risk Dynex Strategy
Invest in shorter duration instruments, with portfolio duration target of 0.5 to 1.5 years Interest Rate Risk Use interest rate swaps, swaptions, and caps to manage risk Match terms of funding with terms of assets
90% of investment portfolio is AAA -rated*at December 31, 2012
Diversify credit risk by investing in multiple asset classes across mortgage sector, including CMBS, Credit Risk Agency and non-Agency RMBS
Only purchase high quality non-Agency MBS
Well-seasoned securitized mortgage loans with low LTV
Chose to minimize extension risk by emphasizing short duration assets Extension Risk Expect minimal extension for short duration hybrid ARMs See examples in appendix
Diversify repurchase agreement counterparties (28 available counterparties at present) Extend maturity dates of repurchase agreements when possible Target staggering repurchase agreement maturities
Liquidity Risk
Maintain cash and liquid instruments to meet margin calls
$55.8 million of cash and cash equivalents, $186 million of unpledged Agency MBS at Dec. 31, 2012 Current leverage of 5.9x invested equity capital
*Agency MBS are considered AAA -rated as of the date presented.
23
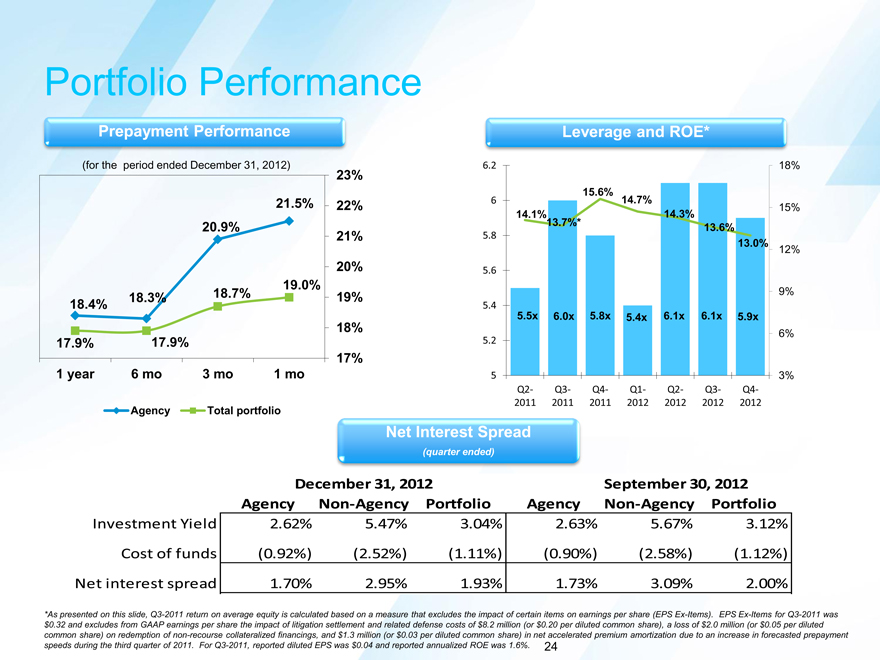
Portfolio Performance
Prepayment Performance Leverage and ROE*
(for the period ended December 31, 2012) 6.2 18%
23%
15.6%
21.5% 22% 6 14.7%
15%
14.1% 14.3% 13.7%*
20.9% 5.8 13.6% 21%
13.0%
12%
20% 5.6 19.0%
18.7% 19% 9% 18.3% 18.4% 5.4
5.5x 6.0x 5.8x 5.4x 6.1x 6.1x 5.9x
18%
6%
17.9% 17.9% 5.2 17%
1 year 6 mo 3 mo 1 mo 5 3%
Q2- Q3- Q4- Q1- Q2- Q3- Q4-2011 2011 2011 2012 2012 2012 2012
Agency Total portfolio
Net Interest Spread
(quarter ended)
December 31, 2012 September 30, 2012 Agency Non-Agency Portfolio Agency Non-Agency Portfolio
Investment Yield 2.62% 5.47% 3.04% 2.63% 5.67% 3.12% Cost of funds (0.92%) (2.52%) (1.11%) (0.90%) (2.58%) (1.12%) Net interest spread 1.70% 2.95% 1.93% 1.73% 3.09% 2.00%
*As presented on this slide, Q3-2011 return on average equity is calculated based on a measure that excludes the impact of certain items on earnings per share (EPS Ex-Items). EPS Ex-Items for Q3-2011 was $0.32 and excludes from GAAP earnings per share the impact of litigation settlement and related defense costs of $8.2 million (or $0.20 per diluted common share), a loss of $2.0 million (or $0.05 per diluted common share) on redemption of non-recourse collateralized financings, and $1.3 million (or $0.03 per diluted common share) in net accelerated premium amortization due to an increase in forecasted prepayment speeds during the third quarter of 2011. For Q3-2011, reported diluted EPS was $0.04 and reported annualized ROE was 1.6%. 24
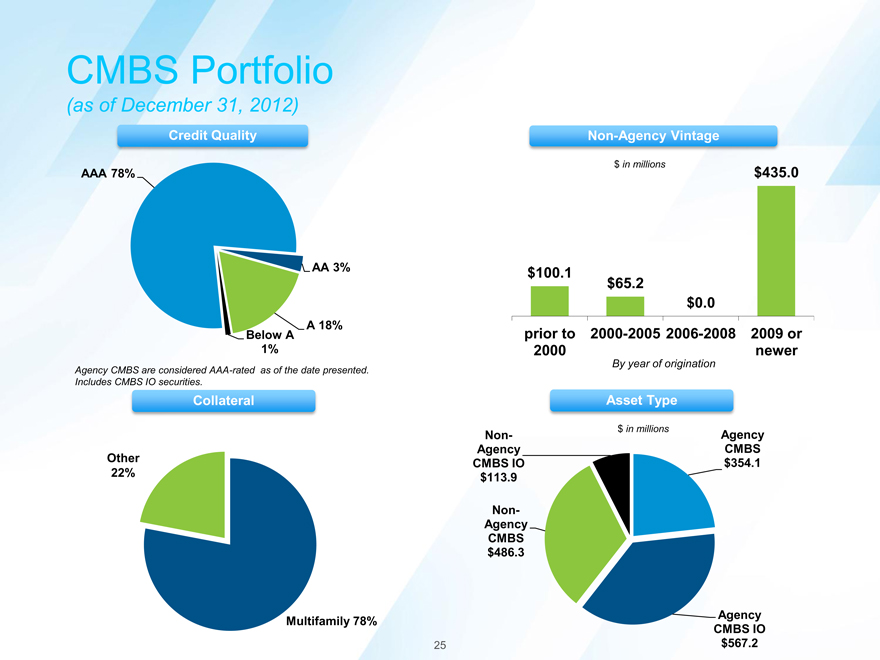
CMBS Portfolio
(as of December 31, 2012)
Credit Quality Non-Agency Vintage
$ in millions
AAA 78% $435.0
AA 3% $100.1 $65.2
$0.0
A 18%
Below A prior to 2000-2005 2006-2008 2009 or
1% 2000 newer
By year of origination
Agency CMBS are considered AAA-rated as of the date presented. Includes CMBS IO securities.
Collateral Asset Type
$ in millions
Non- Agency Agency CMBS
Other CMBS IO $354.1 22% $113.9
NonAgency CMBS $486.3
Agency Multifamily 78% CMBS IO
$567.2
25
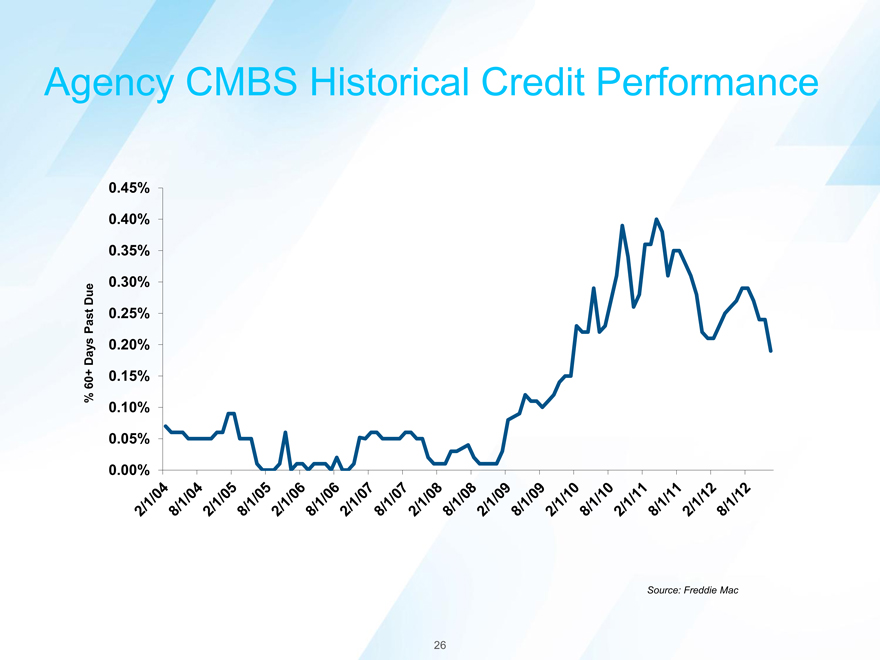
Agency CMBS Historical Credit Performance
% 60+ Days Past Due
0.00% 0.05% 0.10% 0.15% 0.20% 0.25% 0.30% 0.35% 0.40% 0.45%
Source: Freddie Mac
26
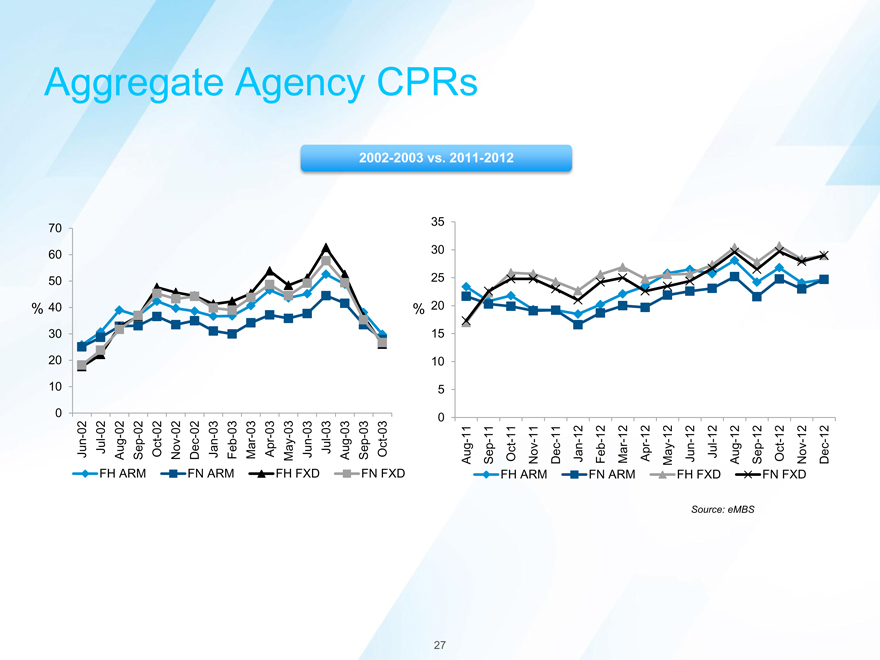
Aggregate Agency CPRs
2002-2003 vs. 2011-2012
70 60 50
% 40 30
20
10
0
Jun-02 Jul-02 Aug-02
Sep-02
Oct-02 Nov-02 Dec-02 Jan-03 Feb-03 Mar-03 Apr-03 May-03 Jun-03 Jul-03 Aug-03 Sep-03 Oct-03
FH ARM FN ARM FH FXD FN FXD
35 30 25
% 20
15
10 5 0
Aug-11
Sep-11
FH Oct-11 ARM Nov-11 Dec-11 Jan-12 FN Feb-12 ARM Mar-12 Apr-12 May-12 FH Jun-12 Source: FXD Jul-12 eMBS Aug-12 Sep-12 FN Oct-12 FXD Nov-12 Dec-12
27
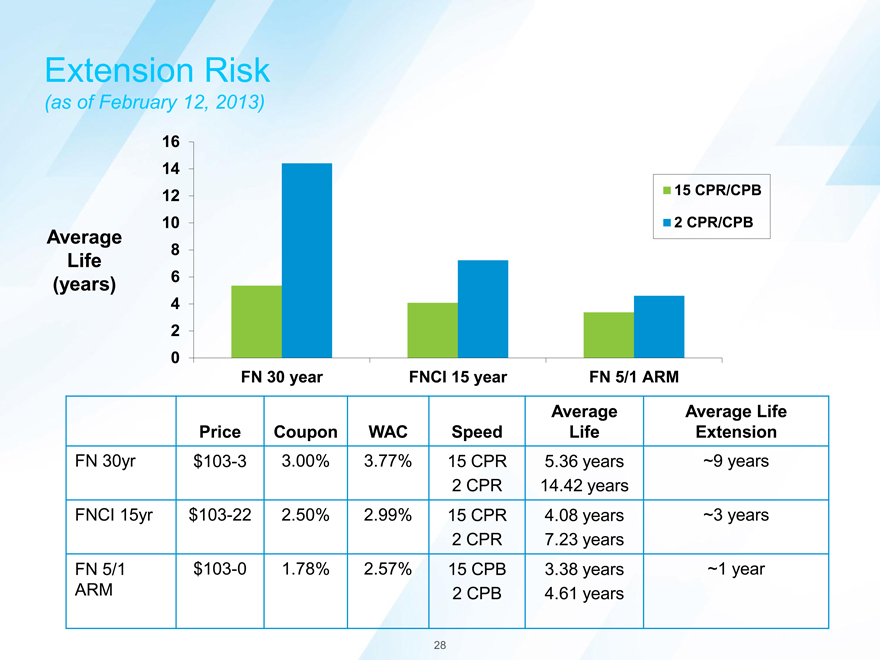
Extension Risk
(as of February 12, 2013)
16 14
12 15 CPR/CPB
10 2 CPR/CPB
Average
8
Life
(years) 6
4 2 0
FN 30 year FNCI 15 year FN 5/1 ARM
FN 30 year FNCI 15 year FN 5/1 ARM
Average Average Life Price Coupon WAC Speed Life Extension
FN 30yr $103-3 3.00% 3.77% 15 CPR 5.36 years ~9 years
2 CPR 14.42 years
FNCI 15yr $103-22 2.50% 2.99% 15 CPR 4.08 years ~3 years
2 CPR 7.23 years
FN 5/1 $103-0 1.78% 2.57% 15 CPB 3.38 years ~1 year ARM 2 CPB 4.61 years
28
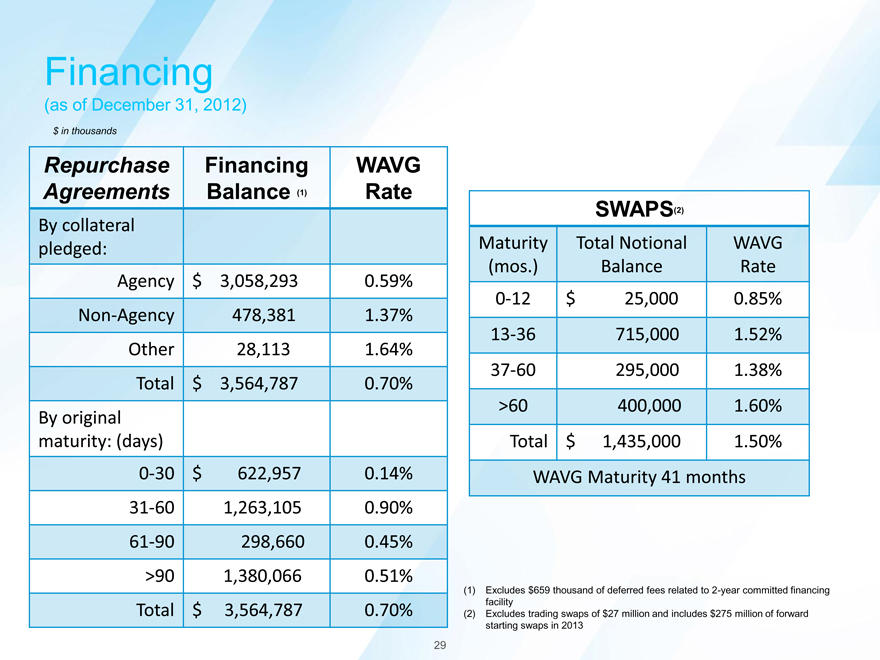
Financing
(as of December 31, 2012)
$ in thousands
Repurchase Financing WAVG Agreements Balance (1) Rate
SWAPS(2)
By collateral pledged: Maturity Total Notional WAVG
Agency $ 3,058,293 0.59% (mos.) Balance Rate 0-12 $ 25,000 0.85% Non-Agency 478,381 1.37% Other 28,113 1.64% 13-36 715,000 1.52% 37-60 295,000 1.38% Total $ 3,564,787 0.70% >60 400,000 1.60% By original maturity: (days) Total $ 1,435,000 1.50% 0-30 $ 622,957 0.14% WAVG Maturity 41 months 31-60 1,263,105 0.90%
61-90 298,660 0.45%
>90 1,380,066 0.51%
(1) Excludes $659 thousand of deferred fees related to 2-year committed financing facility Total $ 3,564,787 0.70% (2) Excludes trading swaps of $27 million and includes $275 million of forward starting swaps in 2013
29